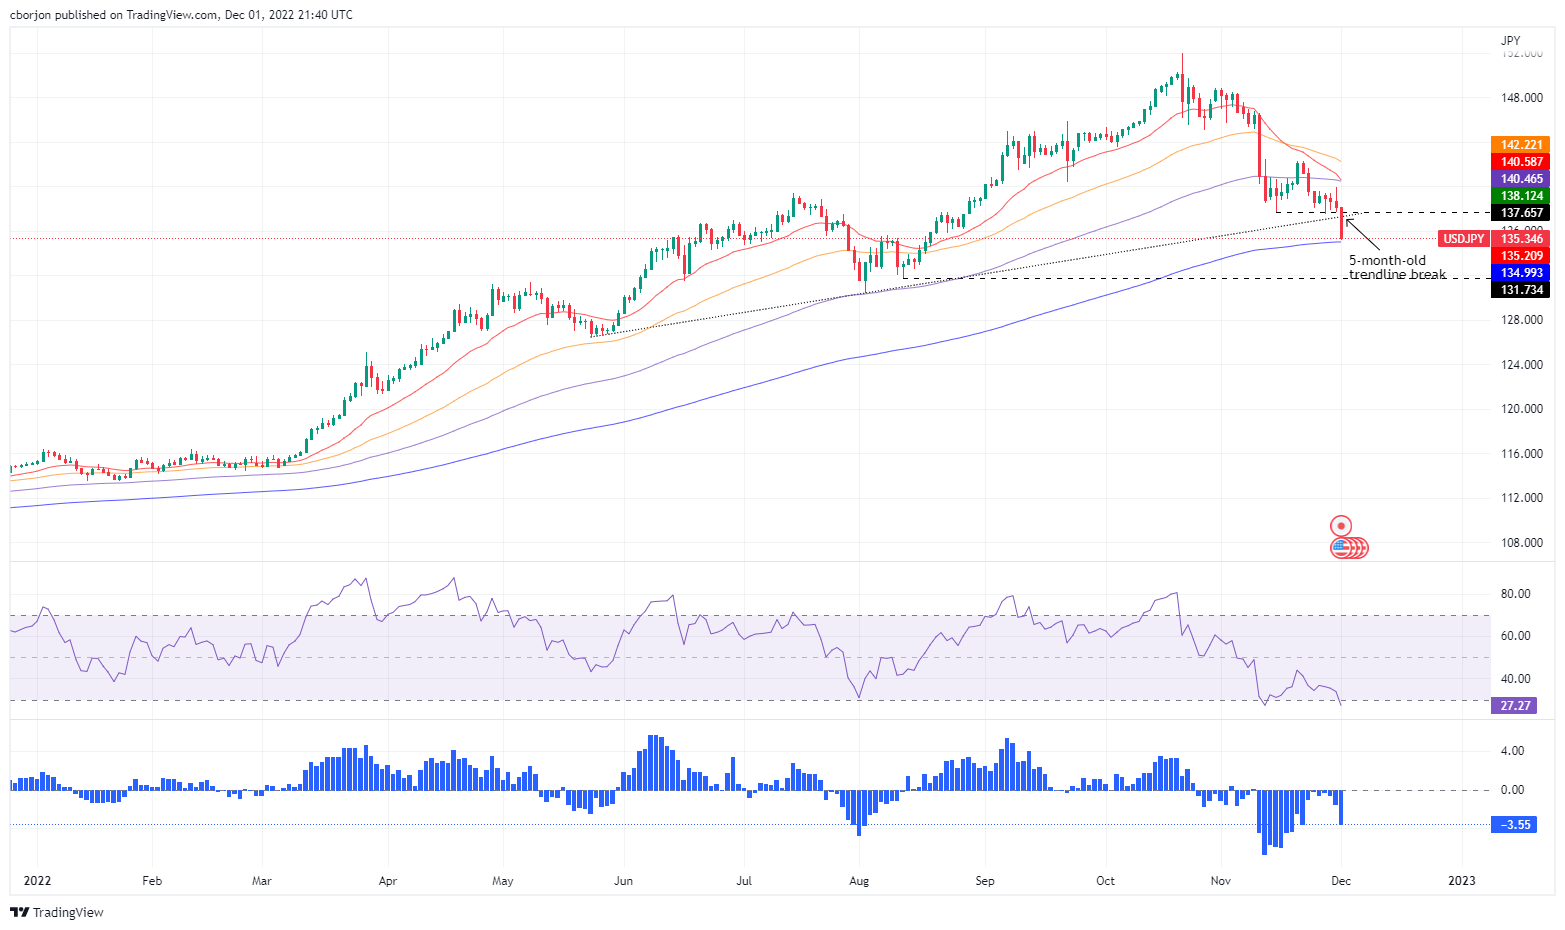
- The USD/JPY breaks a five-month-old trendline, eyeing the 200-day EMA around 134.99.
- Oscillators in bearish territory cement the downtrend, but overbought RSI might refrain USD/JPY short traders.
- USD/JPY: After reclaiming the 200-DMA, a fall toward 131.70 is on the cards.
The USD/JPY plunges below 136.00, extending its losses towards the 135.20s area, spurred by a risk-off impulse and manufacturing activity weakening in the United States (US), posing a recession risk. Therefore, USD/JPY sellers stepped in, below Wednesday's low, of 137.64, and sent the pair tumbling more than 250 pips. At the time of writing, the USD/JPY is trading at 135.34.
USD/JPY Price Analysis: Technical outlook
The USD/JPY shifted neutral-to-downward biased once it cleared the confluence of the 20, and 100-day EMA around 140.46/50. OF note, the 9-period Rate of Change (ROC) is gathering momentum, meaning sellers are in charge. Still, the Relative Strength Index (RSI) entered oversold conditions, meaning that the USD/JPY might consolidate around the 200-day Exponential Moving Average (EMA) at 134.99 before continuing to the downside.
Additionally, the USD/JPY tumbled below a 5-month-old upslope trendline draw from June lows, which exacerbated the downfall. To conclude, the USD/JPY is downward biased in the near term.
Hence, the USD/JPY first support would be 200-day EMA at 134.99. Break below will expose crucial psychological levels like the 134.00 and 133.00 figures, followed by the August 11 low at 131.73.
USD/JPY Key Technical Levels
Information on these pages contains forward-looking statements that involve risks and uncertainties. Markets and instruments profiled on this page are for informational purposes only and should not in any way come across as a recommendation to buy or sell in these assets. You should do your own thorough research before making any investment decisions. FXStreet does not in any way guarantee that this information is free from mistakes, errors, or material misstatements. It also does not guarantee that this information is of a timely nature. Investing in Open Markets involves a great deal of risk, including the loss of all or a portion of your investment, as well as emotional distress. All risks, losses and costs associated with investing, including total loss of principal, are your responsibility. The views and opinions expressed in this article are those of the authors and do not necessarily reflect the official policy or position of FXStreet nor its advertisers. The author will not be held responsible for information that is found at the end of links posted on this page.
If not otherwise explicitly mentioned in the body of the article, at the time of writing, the author has no position in any stock mentioned in this article and no business relationship with any company mentioned. The author has not received compensation for writing this article, other than from FXStreet.
FXStreet and the author do not provide personalized recommendations. The author makes no representations as to the accuracy, completeness, or suitability of this information. FXStreet and the author will not be liable for any errors, omissions or any losses, injuries or damages arising from this information and its display or use. Errors and omissions excepted.
The author and FXStreet are not registered investment advisors and nothing in this article is intended to be investment advice.
Recommended content
Editors’ Picks
EUR/USD edges lower toward 1.0700 post-US PCE

EUR/USD stays under modest bearish pressure but manages to hold above 1.0700 in the American session on Friday. The US Dollar (USD) gathers strength against its rivals after the stronger-than-forecast PCE inflation data, not allowing the pair to gain traction.
GBP/USD retreats to 1.2500 on renewed USD strength

GBP/USD lost its traction and turned negative on the day near 1.2500. Following the stronger-than-expected PCE inflation readings from the US, the USD stays resilient and makes it difficult for the pair to gather recovery momentum.
Gold struggles to hold above $2,350 following US inflation

Gold turned south and declined toward $2,340, erasing a large portion of its daily gains, as the USD benefited from PCE inflation data. The benchmark 10-year US yield, however, stays in negative territory and helps XAU/USD limit its losses.
Bitcoin Weekly Forecast: BTC’s next breakout could propel it to $80,000 Premium

Bitcoin’s recent price consolidation could be nearing its end as technical indicators and on-chain metrics suggest a potential upward breakout. However, this move would not be straightforward and could punish impatient investors.
Week ahead – Hawkish risk as Fed and NFP on tap, Eurozone data eyed too

Fed meets on Wednesday as US inflation stays elevated. Will Friday’s jobs report bring relief or more angst for the markets? Eurozone flash GDP and CPI numbers in focus for the Euro.