|

USD/JPY Price Analysis: Gains momentum near 144.00 ahead of US CPI

  • USD/JPY gains momentum for the fourth consecutive day, just below the 144.00 barrier.
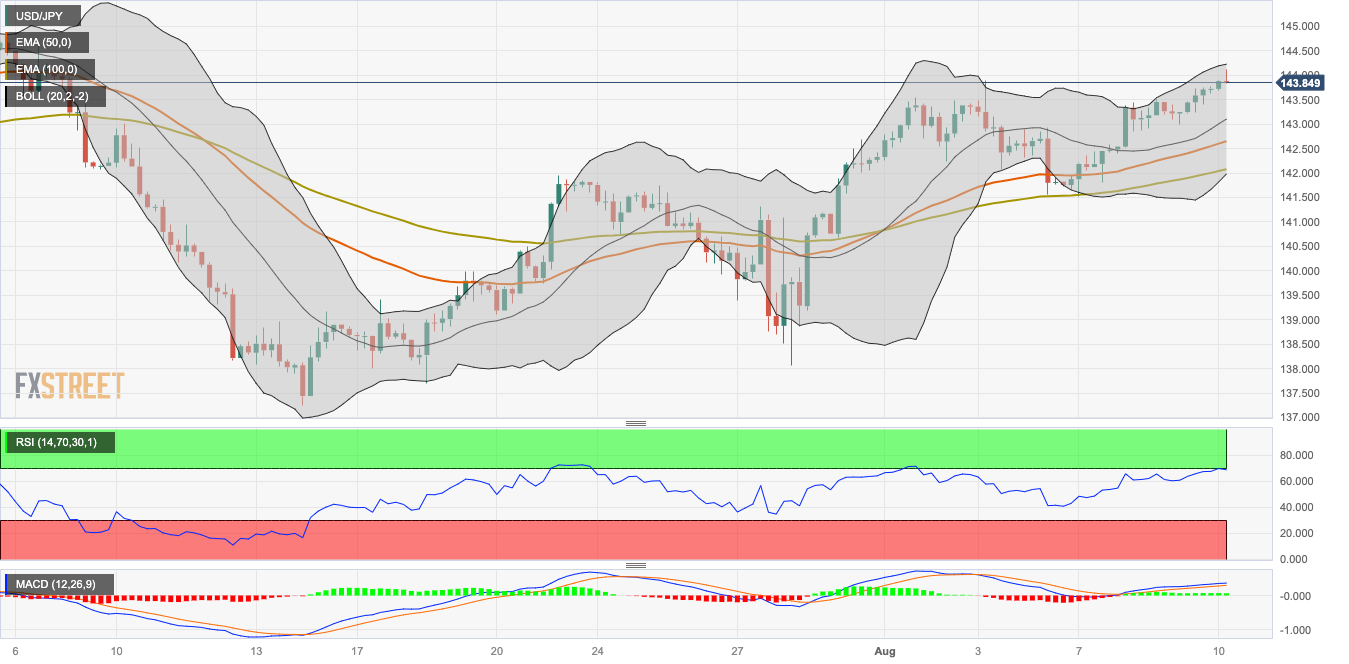
  • The pair stands above the 50- and 100-hour EMAs with an upward slope.
  • The immediate resistance level is seen at 144.65; the initial support level is located at 143.10.

The USD/JPY pair extends its upside for the fourth consecutive day, heading into an early European session on Thursday. The major pair currently trades around 143.95, gaining 0.15% for the day. Market participants await the US Consumer Price Index (CPI) for July for fresh impetus. The US inflation figure is expected to rise from 3% to 3.3%, and the core figure is expected to remain unchanged at 4.8%.

According to the four-hour chart, the USD/JPY pair stands above the 50- and 100-hour Exponential Moving Averages (EMAs) with an upward slope, which means the path of least resistance is to the upside for the major pair.

Any meaningful follow-through buying beyond 144.25 (the upper boundary of the Bollinger Band) could pave the way to the next hurdle at 144.65 (High July 6). The 144.90–145.00 zone will be a tough nut to crack for the USD/JPY pair. The mentioned level is the confluence of a high of June 30 and a psychological round mark.

On the downside, the immediate support level for USD/JPY is located at 143.10, representing the midline of the Bollinger Band en route to 142.65 (50-hour EMA). The additional downside filter is seen at 142.00 (100-hour EMA and the lower limit of the Bollinger Band), and finally at 141.50 (Low of August 7).

It’s worth noting that the Relative Strength Index (RSI) stands around 70 and Moving Average Convergence/Divergence (MACD) stays in bullish territory, which indicates that the upside momentum has been activated for the time being.

USD/JPY four-hour chart

USD/JPY

Overview
Today last price143.95
Today Daily Change0.22
Today Daily Change %0.15
Today daily open143.73
 
Trends
Daily SMA20141.1
Daily SMA50141.48
Daily SMA100138.23
Daily SMA200136.5
 
Levels
Previous Daily High143.75
Previous Daily Low143
Previous Weekly High143.89
Previous Weekly Low140.69
Previous Monthly High144.91
Previous Monthly Low137.24
Daily Fibonacci 38.2%143.46
Daily Fibonacci 61.8%143.29
Daily Pivot Point S1143.23
Daily Pivot Point S2142.74
Daily Pivot Point S3142.49
Daily Pivot Point R1143.98
Daily Pivot Point R2144.24
Daily Pivot Point R3144.73

Author

Lallalit Srijandorn

Lallalit Srijandorn is a Parisian at heart. She has lived in France since 2019 and now becomes a digital entrepreneur based in Paris and Bangkok.

More from Lallalit Srijandorn
Share:

Editor's Picks

EUR/USD eyes nine-day EMA barrier after rebounding from 1.1600

EUR/USD gains ground after registering modest losses in the previous session, trading around 1.1620 during the Asian hours on Friday. The technical analysis of the daily chart suggests an ongoing bearish bias as the pair remains within the descending channel pattern.

GBP/USD: Pound Sterling ticks up against US Dollar in countdown to US NFP

The Pound Sterling trades marginally higher to near 1.3365 against the US Dollar during the Asian trading session on Friday. The GBP/USD pair edges up as the US Dollar ticks down ahead of the United States Nonfarm Payrolls data for February, which will be published at 13:30 GMT.

Gold rises but remains on track for weekly loss in five weeks

Gold price recovers its recent losses from the previous session on Friday. The yellow metal advances as the broader precious metals market rebounds on safe-haven demand. However, the yellow metal is on track for its first weekly decline in five weeks as escalating Middle East tensions push oil prices higher, fueling inflation concerns and reducing bets on Federal Reserve rate cuts.

Bitcoin, Ethereum and Ripple at risk as US-Iran war extends

Bitcoin, Ethereum, and Ripple trade cautiously at press time on Friday, close to key support levels after a roughly 2% pullback the previous day. Bitcoin holds above $71,000, Ethereum at $2,000, and XRP continues to consolidate in a sideways range.

The market compass is pointing at a barrel of Oil

The Asian open is arriving with equities leaning the wrong way, and the reason is not complicated. The market’s compass needle has snapped firmly toward crude. In this tape, oil is not just another input price; it is the gravitational center around which every asset class is orbiting.

Top 3 Price Prediction: Bitcoin, Ethereum, Ripple at risk as US-Iran war extends

Bitcoin, Ethereum, and Ripple trade cautiously at press time on Friday, close to key support levels after a roughly 2% pullback the previous day. Bitcoin holds above $71,000, Ethereum at $2,000, and XRP continues to consolidate in a sideways range.