|

USD/JPY Price Analysis: edges high but remains short of 124.00 post-Fed minutes

  • The USD/JPY remained positive in the week, up 1.11%, amidst a risk-off sentiment and underpinned by the US 10-year yield.
  • USD/JPY Price Forecast: The bias is upwards, but the RSI within the overbought area might suggest caution is warranted.

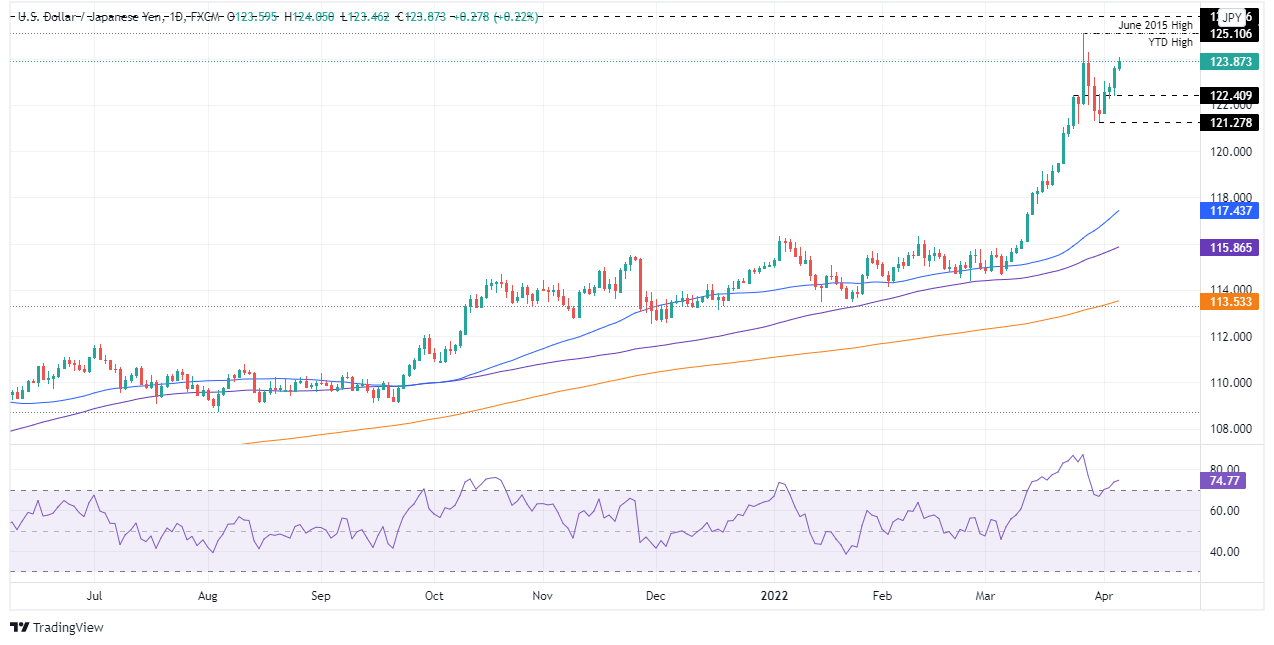
The USD/JPY advances in the North American session amid a risk-off market mood, courtesy of Fed speaking, the continuation of the Russian-Ukraine war, and China’s economy about to slow, as reported by Manufacturing and Services PMIs, which fell below the expansion levels. At the time of writing, the USD/JPY is trading at 123.87.

US equities remain trading in the red, with losses between 0.89% and 2.66%. Meanwhile, the greenback remains buoyant, as shown by the US Dollar Index, a measure of the buck’s value vs. its peers, up 0.25%, sitting at 99.742, underpinned by the 10-year US Treasury yield up to six basis points, currently at 2.622%.

Overnight, the USD/JPY seesawed around the 123.50-124.00 range ahead of the release of the FOMC March meeting. Once unveiled, the USD/JPY dipped towards the daily lows at 123.46 but recovered some ground and is aiming towards the 124.00 mark.

Breaking: FOMC minutes say participants judged it appropriate to move policy towards neutral expeditiously

USD/JPY Price Forecast: Technical outlook

The USD/JPY is upward biased. The daily moving averages (DMAs) reside well below the spot price and confirm the bias. However, the Relative Strength Index (RSI) at 74.65 is well within the overbought area, suggesting that caution is warranted.

That said, the USD/JPY first resistance level would be 124.00. A breach of the latter would expose the YTD high at 125.10, followed by June 2015 swing high at 125.85, followed by April 2001 daily high at 126.85, and then February 2002 pivot high at 135.02.

On the flip side, the USD/JPY first support would be 123.00. A decisive break would open the door towards 121.27, but it would find some hurdles on its way south. Once 123.00 gives way, the next support would be 122.41, followed by 122.00 and then March’s 31 daily low at 121.27.
USD/JPY

Overview
Today last price123.87
Today Daily Change0.27
Today Daily Change %0.22
Today daily open123.61
 
Trends
Daily SMA20120.36
Daily SMA50117.27
Daily SMA100115.78
Daily SMA200113.49
 
Levels
Previous Daily High123.67
Previous Daily Low122.38
Previous Weekly High125.1
Previous Weekly Low121.28
Previous Monthly High125.1
Previous Monthly Low114.65
Daily Fibonacci 38.2%123.17
Daily Fibonacci 61.8%122.87
Daily Pivot Point S1122.77
Daily Pivot Point S2121.93
Daily Pivot Point S3121.48
Daily Pivot Point R1124.06
Daily Pivot Point R2124.51
Daily Pivot Point R3125.35

Author

Christian Borjon Valencia

Markets analyst, news editor, and trading instructor with over 14 years of experience across FX, commodities, US equity indices, and global macro markets.


More from Christian Borjon Valencia
Share:

Editor's Picks

GBP/USD stays positive near 1.3450 after UK jobs data

GBP/USD recovers ground and tests 1.3450 in early Europe on Tuesday. The UK ILO Unemployment Rate remained at 4.9% in the three months to May, compared with expectations of 5%, but fails to provide any impetus to the British Pound's renewed uptick. Traders stay cautious amid US-Iran uncertainty and the UK political transition.

EUR/USD steadies above 1.1400, awaits German ZEW Survey

EUR/USD is consolidating above the 1.1400 mark in European trading on Tuesday. The pair lacks any directional impetus amid a subdued US Dollar price action and ahead of the German ZEW Survey.


Gold: Acceptance above 21-day SMA at $4,065 is critical for buyers

Gold is building on its recovery from two-week lows of $4,024 reached last Friday, extending the winning streak into a third straight day on Tuesday. XAU/USD is capitalizing on the ongoing pullback in Oil prices from monthly highs near $84.50. The black gold is retreating for a second day in a row on emerging signs of diplomatic efforts to ease the US-Iran conflict.

Shiba Inu price extends gains as on-chain and derivatives metrics confirm bullish bias

Shiba Inu extends gains, trading above $0.0000042 after breaking above the descending trendline the previous day. Strengthening on-chain data and improving derivatives metrics support further gains for the meme coin. CryptoQuant’s exchange netflow chart below shows five consecutive days of net outflows since July 17.

Brent nears a critical crossroads as the global economy faces one too
Markets spent last Friday digesting a Reuters report that Iran has told the Houthis to stand ready to close Bab el-Mandeb if the US strikes Iranian power infrastructure — missiles and drones are reportedly already positioned near the strait, awaiting the order from IRGC officers in Yemen.
US Dollar mid-year outlook: Exceptional currency, exceptional risks?
The US Dollar enters the second half of 2026 in a markedly different position from a year ago. The King currency has recovered, reflecting persistent US inflation, changing expectations for Fed policy, geopolitical tensions and renewed demand for defensive assets.