|

USD/JPY Price Analysis: Bulls consolidated near 110.20

  • USD/JPY kickstarts the new trading session on a positive note.
  • Pair finds support in the double bottom near 109.50 level.
  • MACD holds onto the overbought zone with a neutral stance.

USD/JPY accumulates minor gains on the first day of the fresh trading week. The pair opened above the 110.00 mark and continued to push higher.

At the time of writing, USD/JPY is trading at 110.23, up 0.06% for the day.

USD/JPY daily chart

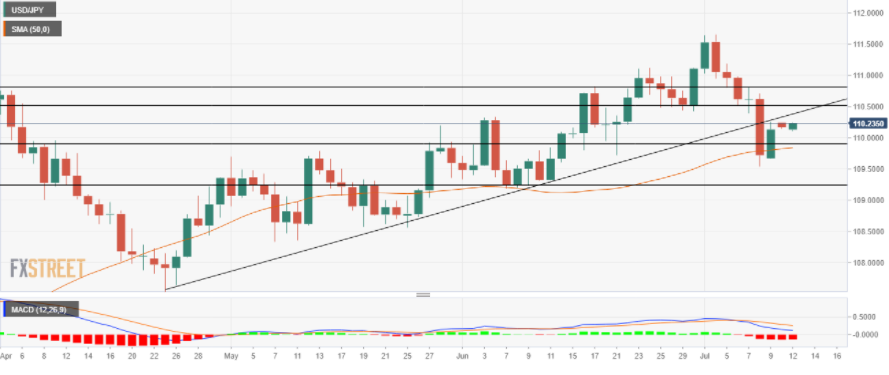
On the daily chart, after making a fresh YTD high at 111.65 on July 2, USD/JPY came under selling pressure. The pair tested weekly lows near 109.50 but managed to close higher.

That said, if the price breaks 110.25 decisively, which is the previous day's high, it could be able to test the 110.50 horizontal resistance level.

The ascending trendline from the lows of 107.47 acts as a defence for the bulls. A break of the bullish sloping line will further push the price higher toward the 110.80 horizontal resistance level.

The next area of resistance would be the high of July 5 in the vicinity of the 111.20 area.

On the flip side, the Moving Average Convergence Divergence (MACD) indicator is in an overbought zone with a neutral stance. Any downtick in the MACD could prompt the pair to move toward the south.

In doing so, the interim support would emerge at 50-day Simple Moving Average (SMA) at 109.84. 

A daily close below the above level would motivate USD/JPY bears to retest Thursday’s low at 109.53.

Next, the market participants would look out for the 109.20 horizontal support level.

Author

Rekha Chauhan

Rekha Chauhan

Independent Analyst

Rekha Chauhan has been working as a content writer and research analyst in the forex and equity market domain for over two years.

More from Rekha Chauhan
Share:

Editor's Picks

EUR/USD risks a deeper drop below 1.1750

EUR/USD keeps its vacillating mood in place as the the NA session drwas to a close on Tuesday, hovering below the 1.1800 hurdle amid acceptable gains in the US Dollar. In the meantime, market participants and the FX galaxy are expected to closely follow President Trump’s SOTU speech around 2AM GMT.
 

GBP/USD regains 1.3500 and above

GBP/USD extends its advance for the third day in a row on Tuesday, this time retesting the area beyond the 1.3500 hurdle. Cable’s uptick comes despite decent gains in the Greenback and the dovish message from the BoE’s Bailey at the UK Parliament.

Gold appears offered around $5,150

Gold is giving back a good portion of the recent multi-day rally, receding to the $5,150 zone per troy ounce amid the decent bounce in the US Dollar and mixed US Treasuty yields. In the meantime, markets’ attention remain on upcoming comments from Fed speakers.

Australia CPI to highlight persistent price pressures, backing a hawkish outlook

Australia will release its key set of inflation figures for the month of January on Wednesday, with the Consumer Price Index expected to rise by 3.7%, slightly lower than the 3.8% in the last month of 2025.

The Citrini report: How a debatable AI narrative can shake Wall Street

That AI-related headline alone was enough to rattle investors.US stocks slid sharply on Monday after a widely circulated Citrini Research memo outlined a hypothetical “2028 Global Intelligence Crisis”, warning that rapid AI adoption could push US unemployment into double digits as early as by mid-2028.

XRP pressured by weak ETF flows and declining retail interest

Ripple (XRP) is edging lower, trading above its intraday low of $1.32 at the time of writing on Tuesday. The decline from its weekly opening of $1.39 reflects heightened volatility in the broader cryptocurrency market, accentuated by tariff-triggered uncertainty.