|

USD/JPY Price Analysis: 100-hour SMA near 150.00 holds the key for bulls ahead of US PCE data

  • USD/JPY meets with some supply on Friday and snaps a three-day winning streak to the YTD top.
  • Intervention fears benefit the JPY and exert pressure on the pair amid subdued USD price action.
  • The divergent Fed-BoJ policy outlook should limit the downside ahead of the US PCE Price Index.

The USD/JPY pair edges lower during the Asian session on Friday and for now, seems to have snapped a three-day winning streak to its highest level since October 2022, around the 150.75-150.80 region touched the previous day. Spot prices, however, manage to hold above the 150.00 psychological mark as traders keenly await the US PCE Price Index before positioning for the next leg of a directional move.

In the meantime, speculations that the Japanese government will intervene in FX markets to stem any further weakness in the Japanese Yen (JPY) exert some pressure on the USD/JPY pair amid subdued US Dollar (USD) price action. That said, a big divergence in the monetary policy stance adopted by the Federal Reserve (Fed) and the Bank of Japan (BoJ) should help limit the downside. Investors might also refrain from placing aggressive bets ahead of next week's central bank event risks – the BoJ meeting on Tuesday, followed by the crucial FOMC decision on Wednesday.

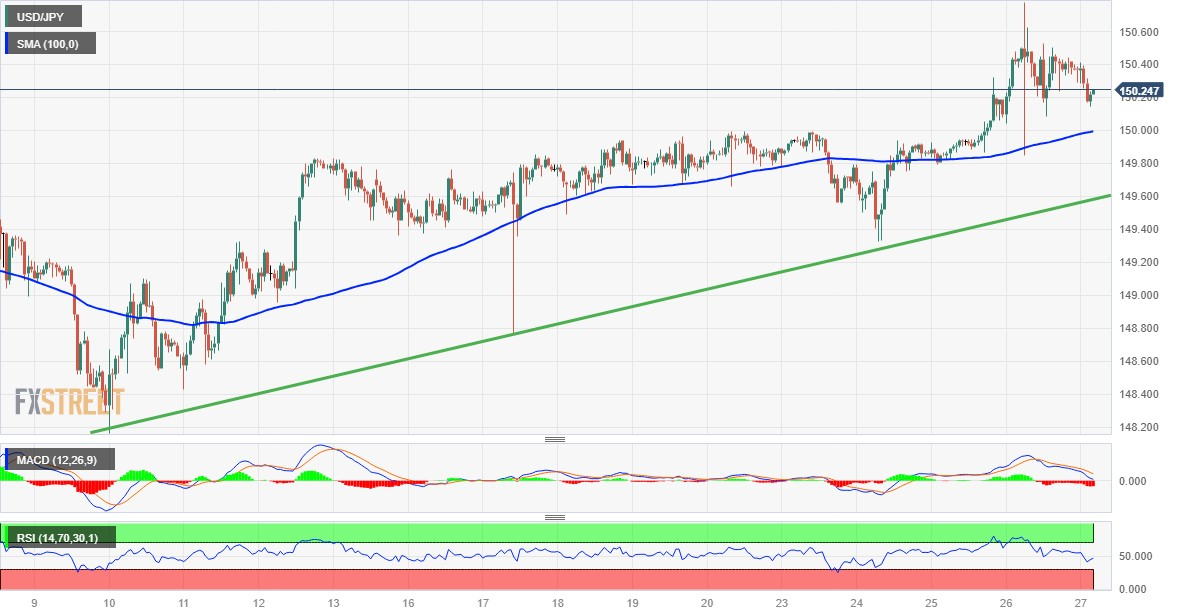
From a technical perspective, the overnight intraday downfall showed some resilience below the 100-hour Simple Moving Average (SMA). The said support, currently pegged around the 150.00 mark, should now act as a pivotal point for intraday traders, below which the USD/JPY pair could accelerate the slide towards an ascending trend-line support near the 149.65 area. Some follow-through selling will be seen as a fresh trigger for bearish traders and pave the way for a slide towards the 149.30 intermediate support before spot prices drop to the 149.00 round figure.

The downward trajectory could get extended further towards the next relevant support near the 148.70 region en route to the 148.25 horizontal zone and the 148.00 mark. The USD/JPY pair could eventually fall to the 147.30-147.25 region, or the monthly swing low touched on October 3.

On the flip side, the YTD peak, around the 150.75-150.80 region touched on Thursday, now seems to act as an immediate hurdle ahead of the 151.00 mark. Some follow-through buying has the potential to push the USD/JPY pair closer to the 152.00 mark, or a multi-decade high touched in October 2022.

USD/JPY 1-hour chart

fxsoriginal

Technical levels to watch

USD/JPY

Overview
Today last price150.23
Today Daily Change-0.18
Today Daily Change %-0.12
Today daily open150.41
 
Trends
Daily SMA20149.51
Daily SMA50148.11
Daily SMA100145.15
Daily SMA200139.78
 
Levels
Previous Daily High150.78
Previous Daily Low149.85
Previous Weekly High149.99
Previous Weekly Low148.76
Previous Monthly High149.71
Previous Monthly Low144.44
Daily Fibonacci 38.2%150.42
Daily Fibonacci 61.8%150.2
Daily Pivot Point S1149.91
Daily Pivot Point S2149.41
Daily Pivot Point S3148.98
Daily Pivot Point R1150.84
Daily Pivot Point R2151.28
Daily Pivot Point R3151.77

Author

Haresh Menghani

Haresh Menghani is a detail-oriented professional with 10+ years of extensive experience in analysing the global financial markets.

More from Haresh Menghani
Share:

Editor's Picks

GBP/USD bounces off lows, back above 1.3200

After bottoming out near 1.3160, GBP/USD manages to regain a bit of shine and reclaim the 1.3200 mark and beyond at the end of the week. Stronger-than-expected UK Retail Sales data seem to be helping the British Pound limit its losses, while the chaotic UK political environment keeps the bulls at bay for now.

EUR/USD looks consolidative around 1.1460

EUR/USD stages a modest rebound after slipping to a three-month low below 1.1420 at the end of the week. That said, the pair now looks to consolidate humble gains just above 1.1460 despite growing uncertainty surrounding the next round of US-Iran negotiations, which keeps the US Dollar’s downside contained.

Gold slips back to six-day lows, targets $4,100

Gold retreats for the third consecutive day on Friday, eroding gains seen in the first half of the week and approaching the key $4,100 mark per troy ounce. Indeed, the precious metal continues to face headwinds from the Fed's hawkish stance and renewed uncertainty surrounding the next round of US-Iran negotiations.

Solana extends correction despite ETF inflows, RWA adoption

Solana (SOL) price edges below $70 extending its losses for the fourth straight day this week. The institutional demand for Solana is building, with steady inflows so far this week and Morgan Stanley’s amended S-1 filing for a Solana-focused Exchange-Traded Fund.

The Iran war didn't break the US economy, but what happens next?

Nearly four months after the start of the Iran war, the US economy remains remarkably resilient. While the conflict initially triggered a severe disruption to global energy markets and a sharp rise in Oil prices, recent diplomatic progress between Washington and Tehran has eased concerns about a prolonged supply shock.

Regime change: Inside Kevin Warsh's first move to make the Fed unreadable on purpose

The rate did not move. That was the least interesting thing about Kevin Warsh's first meeting in charge of the Fed. The FOMC held its benchmark at 3.50%-3.75% for the fourth straight meeting, exactly as priced, and then the new chair used his first press conference to dismantle the machinery the market has leaned on for a decade.