USD/JPY hits highest bids in a year, taps 150.32
- The USD/JPY has set a new 12-month high early Thursday, tipping over 150.30 as the Yen recedes further.
- US Treasuries continue to push into 16-year highs, bolstering the US Dollar.
- 150.00 remains a critical level for the USD/JPY, a historical defensive level for the BoJ.

The USD/JPY ripped into a twelve-month high above 150.30 late Wednesday as markets continue to test the Bank of Japan's (BoJ) resolve at defending the 150.00 handle, a level that has seen the BoJ draw a line in the sand on multiple occasions in the past.
The US Dollar continues to get a boost from broad-market risk aversion, coupled with rising US Treasury yields that continue to knock into 16-year highs. The 10-year T-note settled at 4.957% on Wednesday, a yield that the 10-year Treasury bond hasn't seen since early 2007.
The Bank of Japan (BoJ) remains one of the only major central banks that hasn't raised interest rates meaningfully over the last two years in a bid to stoke additional long-run inflation in Japan, but the Japanese central bank still fears that inflation pressures within Japan's economy may undershoot their 2% target.
Wall Street investors are banking on a change in the BoJ's strategies, possibly as soon as their next meeting, which could involve the BoJ abandoning their yield curve control mechanism, or their negative-rate short-term rate regime.
Friday's Asia market session will see another round of Japanese inflation data, with the Tokyo Consumer Price Index (CPI) slated for 23:30 GMT Thursday.
The Core Tokyo CPI (headline inflation less volatile food prices) is expected to hold steady at 2.5% for the year into October, and investors will be keeping a close eye on the CPI inflation print to see if the BoJ will get punished into making policy adjustments soon.
USD/JPY Technical Outlook
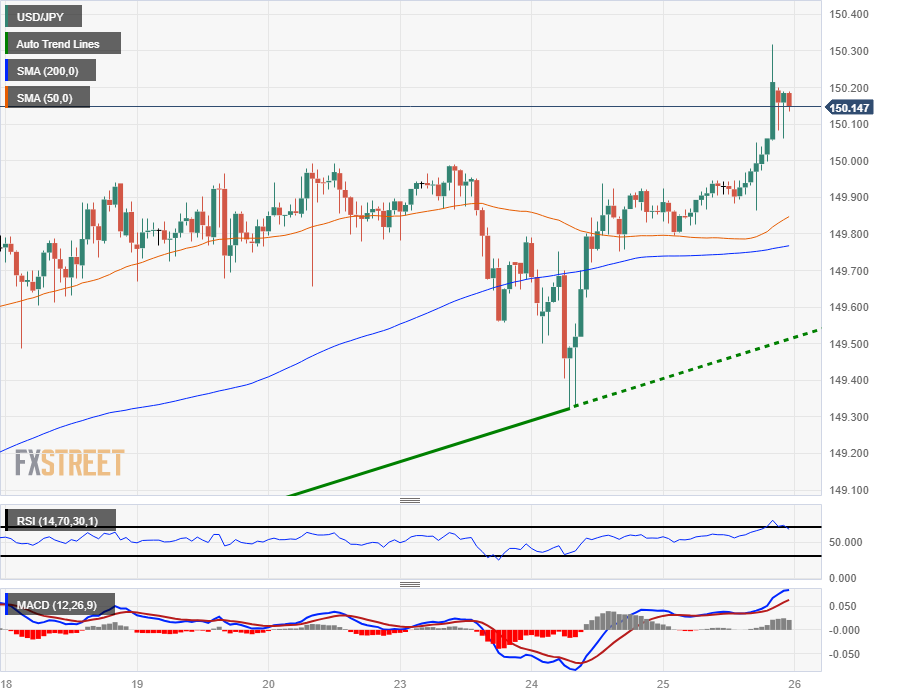
The USD/JPY rallied into 150.32 late Wednesday, knocking into a new high for 2023 and knocking on the pair's highest bids in twelve months.
Despite the Dollar-fueled pump, the pair is trading back below 150.20 heading into Thursday's Asia trading session.
The USD/JPY is now trading into no-man's-land, with little technical resistance above to mark in meaningful boundaries, but the pair's long term bullish stance for the majority of 2023 sees little in the way of technical support outside of the 50-day Simple Moving Average (SMA) currently lifting into 148.00, while the 200-day SMA languishes near 140.00, far below current price action.
USD/JPY Hourly Chart
USD/JPY Technical Levels
Author

Joshua Gibson
FXStreet
Joshua joins the FXStreet team as an Economics and Finance double major from Vancouver Island University with twelve years' experience as an independent trader focusing on technical analysis.


