USD/JPY finds its highest bids since 1990, approaches 156.00
- US Dollar tips into a fresh 34-year high against Japanese Yen on Wednesday.
- BoJ policy statement is expected as markets await Yen intervention.
- US data sends mixed shocks through markets as Fed watchers look on.

USD/JPY broke into its highest chart territory since June of 1990 on Wednesday, peaking near 155.40 for the first time in 34 years as the Japanese Yen continues to tumble across the broad fx market. According to reporting from Nikkei, the Bank of Japan (BoJ) is expected to discuss “impact of accelerating Yen depreciation”, a clear sign to market participants that BoJ intervention in the fx markets could be impending if the JPY continues to soften.
Key US data is due in the back half of the trading week with US Gross Domestic Product (GDP) and US Personal Consumption Expenditure (PCE) Price Index inflation slated for Thursday and Friday, respectively. US GDP is expected to ease to 2.5% for the annualized first quarter compared to the previous 3.4%. US Core PCE inflation in March is forecast to hold steady in March.
Investors hoping for signs of rate cuts from the US Federal Reserve (Fed) will continue to celebrate downside economic indicators from the US, and will be hoping for slowing GDP growth and easing PCE inflation prints.
The BoJ will be releasing its latest Monetary Policy Statement early Friday, and a press conference from BoJ Governor Kazuo Ueda is expected to follow at an unspecified time. Before the BoJ, Japan’s Tokyo Consumer Price Index (CPI) for the year ended April will print in the early Friday market session. Headline Tokyo YoY CPI is expected to hold steady at 2.6% in April, with Core-core Tokyo CPI inflation (headline inflation less volatile food and energy prices) expected to tick down slightly to 2.7% from 2.9%.
USD/JPY technical outlook
With the pair hitting its highest bids in over three decades, USD/JPY is on pace to close in the green for a fourth consecutive month. The pair is up nearly 6% from the last swing low near 146.50 in March, and USD/JPY has climbed almost 8% since crossing the 200-day Exponential Moving Average (EMA) at the beginning of 2024.
USD/JPY daily chart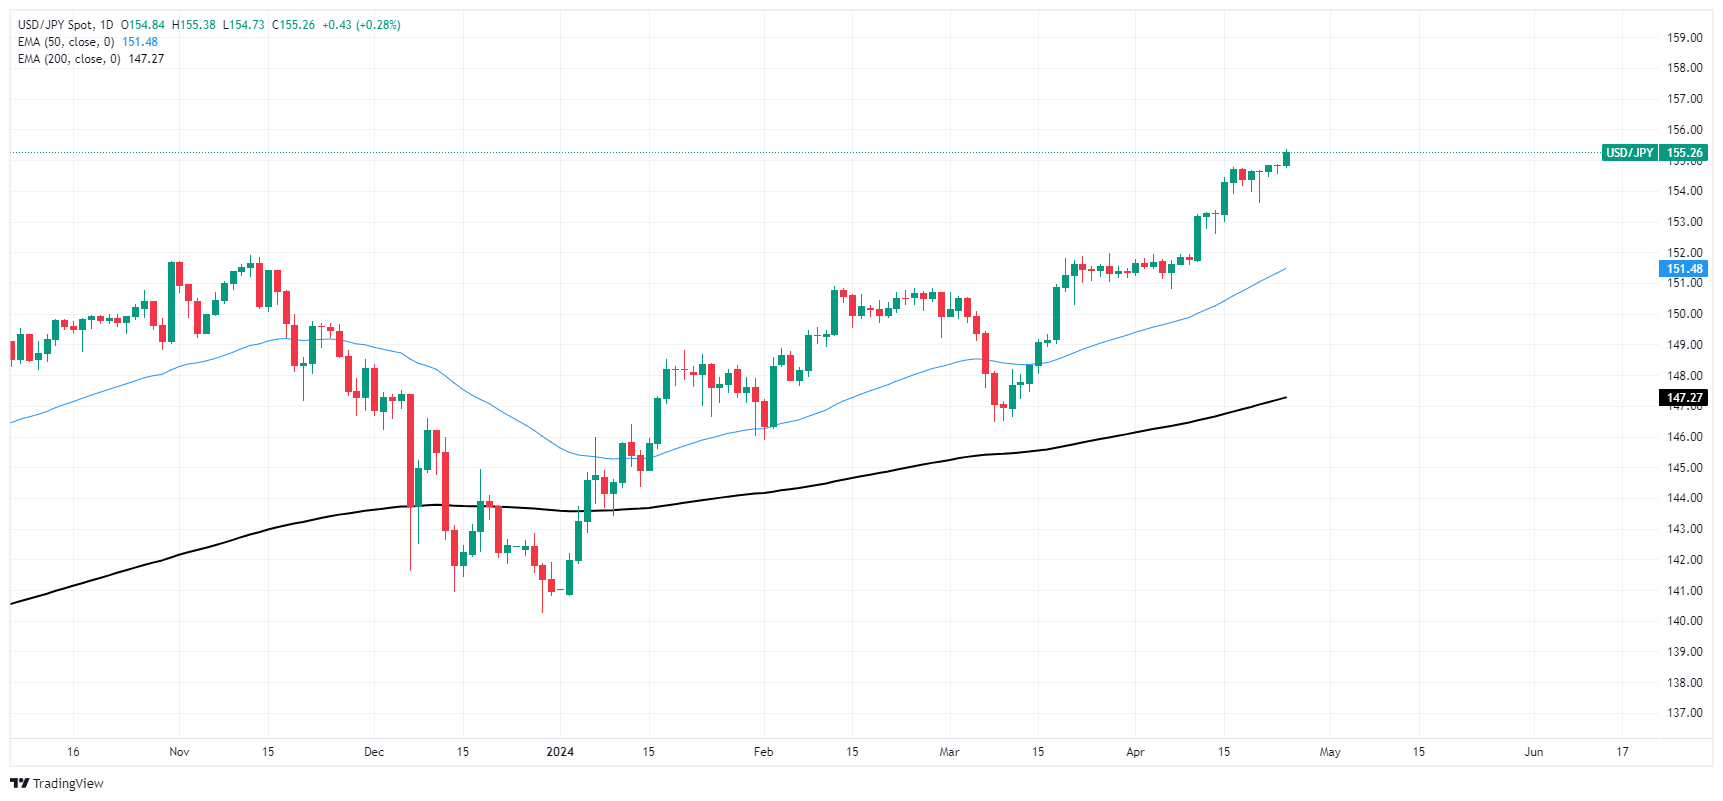
Author

Joshua Gibson
FXStreet
Joshua joins the FXStreet team as an Economics and Finance double major from Vancouver Island University with twelve years' experience as an independent trader focusing on technical analysis.