USD/JPY dips below 150.00 amid rising Tokyo inflation, while US core PCE remains unchanged
- USD/JPY drops from daily high of 150.41 to 149.70s, down 0.40%, amid strengthening Yen.
- US core PCE for September at 3.7% YoY, with general inflation at 3.4%, both in line with estimates.
- Tokyo's core inflation rose to 2.7% YoY, exceeding forecasts of 2.5%, while headline data rose above 3.3% YoY, above September’s 2.8%.

USD/JPY retreats from daily highs of 150.41 reached during the Asian session, extending its losses below the 150.00 figure after the Japanese Yen (JPY) strengthened, following an uptick in Japan’s inflation. Meanwhile, economic data in the United States (US) shows inflation appears to be stickier than expected, though sponsored a leg down in the major, toward the 149.60s area, down 0.45%.
Japanese Yen gains ground following uptick in Japan's inflation, while US data shows sticky inflation
The US Federal Reserve (Fed) preferred gauge for inflation was reported early on Friday, as the core Personal Consumption Expenditures (PCE) in September rose by 3.7% YoY, as expected but below August’s 3.8%, while general inflation stood at 3.4%, YoY aligned with estimates and the prior’s month numbers.
Additional data in the report released by the US Bureau of Economic Analysis (BEA) showed an increase in Personal Spending, at 0.7% MoM, above forecasts of 0.5%, showing that consumer spending is gathering pace, following yesterday's Gross Domestic Product (GDP) report for Q3, at 4.9%, crushing estimates of 4.3%.
Despite all that, expectations for further Fed rate increases remain subdued, as shown by the CME FedWatch Tool, which foresees no hikes for December 2023 and witnessed January’s 2024 odds diminish to 28.91%, from 1-month ago of 37.7%. Consequently, the US 2-year Treasury bond yield retreated two basis points, although it sits at 5.02%, weighed on the Greenback, which is down 0.25%, with the US Dollar Index (DXY) hoovering at 106.34.
Aside from this, core inflation in Tokyo, usually seen as a leading indicator of nationwide inflation, accelerated unexpectedly, raising speculations the Bank of Japan (BoJ) could revise up its inflation forecasts at the upcoming week’s monetary policy meeting.
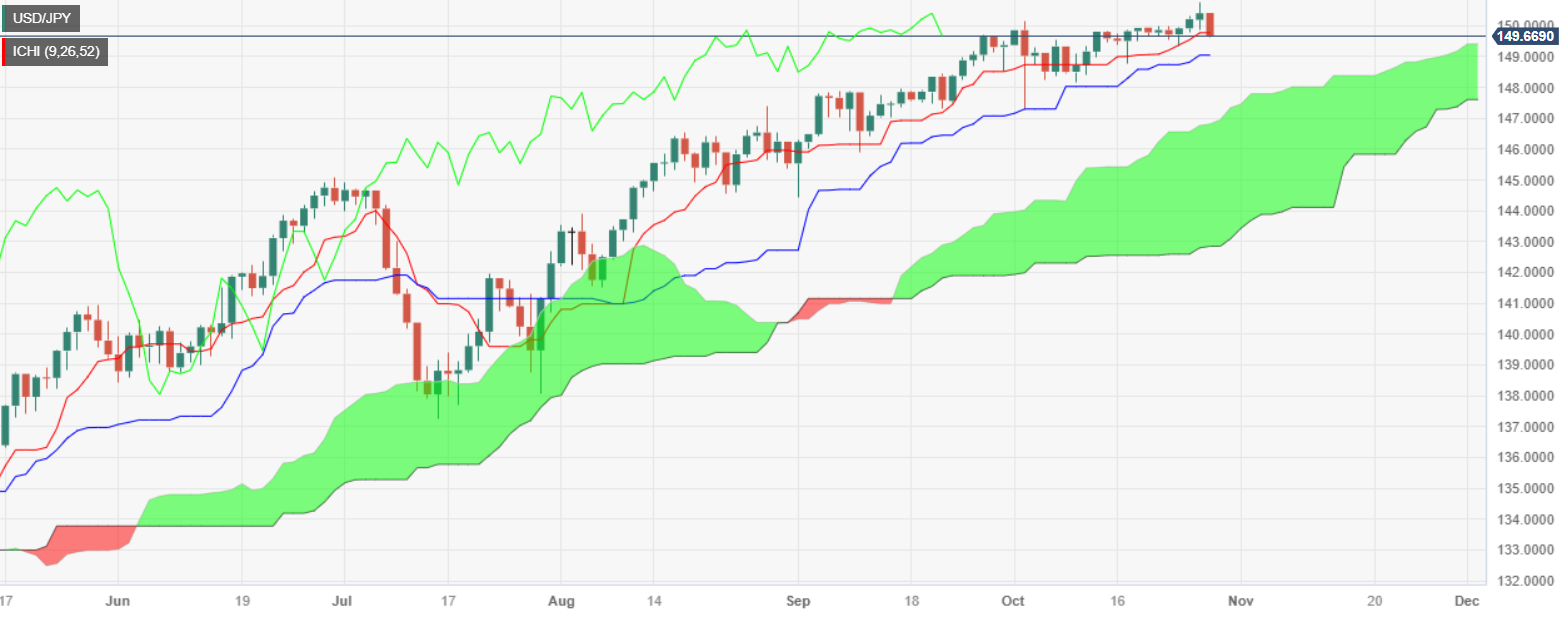
USD/JPY Price Analysis: Technical outlook
The USD/JPY daily chart shows the pair dipped toward the Tenkan-Sen at 149.75, which, if broken, the air can slide to the Kijun-Sen at 149.02. further support lies below that level, at October’s 17 swing low of 148.73. Conversely, if buyers reclaim 150.00, the next resistance would be the October 26 high at 150.77.
Author

Christian Borjon Valencia
FXStreet
Markets analyst, news editor, and trading instructor with over 14 years of experience across FX, commodities, US equity indices, and global macro markets.


