- The US Dollar broadly climbed on Thursday after US CPI inflation broadly beat the street.
- US Initial Jobless Claims also improved, US labor market looking stubbornly firm.
- Japan Current Account, US PPI still due for Friday.
The USD/JPY climbed early in Thursday’s US market session after US Consumer Price Index (CPI) inflation numbers broadly beat market forecasts, with inflation stepping higher in December and completely swamping out market hopes for signs that rate cuts would be impending soon.
US CPI inflation climbs to 3.4% in December vs. 3.2% expected
US headline CPI inflation for the year ended December came in at 3.4% versus the market forecast of 3.2%, handily climbing over the previous period’s 3.1. December’s MoM CPI came in higher than expected at 0.3% versus the forecast 0.2%, and climbing further over November’s 0.1% print.
US Initial Jobless Claims for the week ended January 5 also came in better than expected, printing at 202K versus the anticipated 210K, though the previous week did see a slight upside revision to 203K (pre-revision 202K).
The US Dollar (USD) caught a broad-market bid after the CPI inflation print as market hopes of impending rate cuts from the Federal Reserve dashed on the rocks of rising inflation metrics. Many investors were hoping for inflation to cool at least enough to keep the dream of a March rate cut alive, with money markets pricing in a 60% chance of a March rate cut as recently as yesterday.
The week isn’t over yet, and the USD/JPY still has to grapple with Japanese Trade Balance and Current Account figures due early Friday, while US producer-facing inflation will be printing tomorrow. The US Producer Price Index (PPI) for December is expected to tick slightly higher from 0.0% to 0.1%, while annualized Core PPI for the year ended December is expected to clip lower from 2.0% to 1.9%.
USD/JPY Technical Outlook
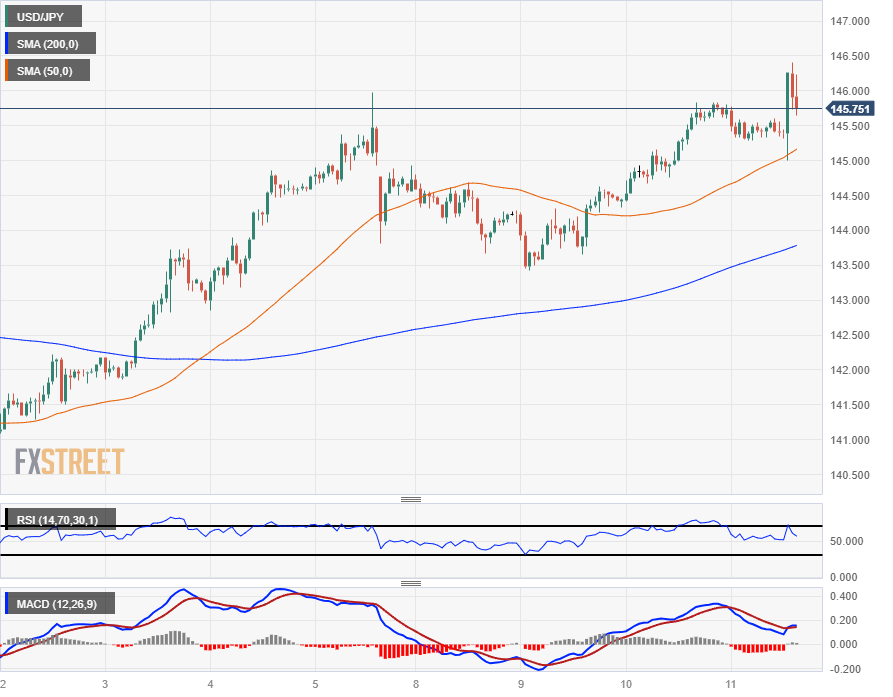
The USD/JPY rose to a near-term high of 146.41 before falling back into Thursday’s intraday levels with the US Dollar getting driven higher against the already-softening Japanese Yen (JPY). With the USD/JPY continuing to test higher, the 200-hour Simple Moving Average (SMA) is set to continue climbing through the 144.00 handle, building out an intraday technical floor.
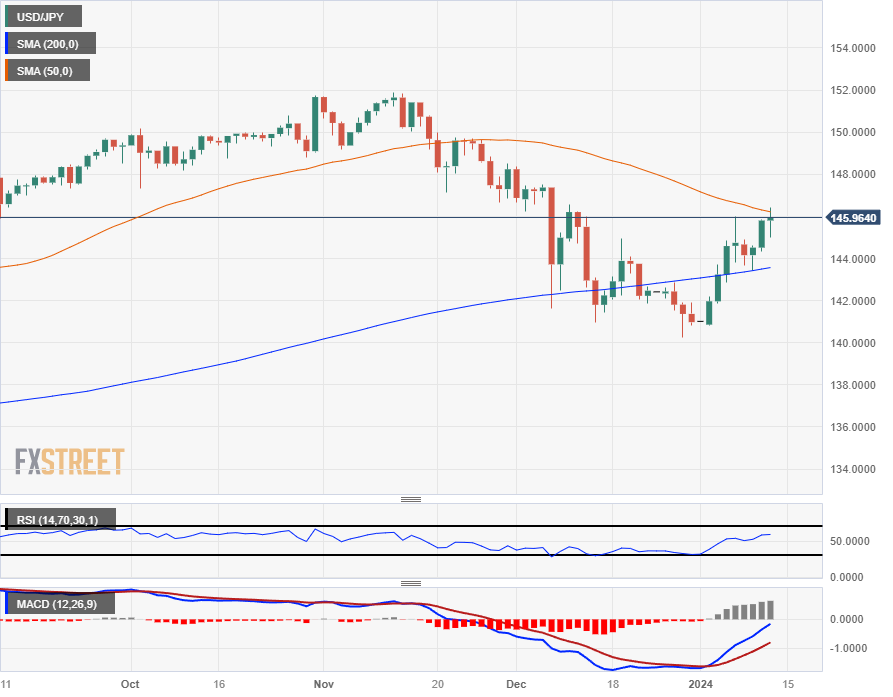
Daily candlesticks have the USD/JPY running into near-term technical resistance at the 50-day SMA descending into 146.00, and prices are caught on the topside of the 200-day SMA approaching 144.00, with USD/JPY caught in the congestion zone of the two moving averages.
USD/JPY Hourly Chart
USD/JPY Daily Chart
USD/JPY Technical Levels
Information on these pages contains forward-looking statements that involve risks and uncertainties. Markets and instruments profiled on this page are for informational purposes only and should not in any way come across as a recommendation to buy or sell in these assets. You should do your own thorough research before making any investment decisions. FXStreet does not in any way guarantee that this information is free from mistakes, errors, or material misstatements. It also does not guarantee that this information is of a timely nature. Investing in Open Markets involves a great deal of risk, including the loss of all or a portion of your investment, as well as emotional distress. All risks, losses and costs associated with investing, including total loss of principal, are your responsibility. The views and opinions expressed in this article are those of the authors and do not necessarily reflect the official policy or position of FXStreet nor its advertisers. The author will not be held responsible for information that is found at the end of links posted on this page.
If not otherwise explicitly mentioned in the body of the article, at the time of writing, the author has no position in any stock mentioned in this article and no business relationship with any company mentioned. The author has not received compensation for writing this article, other than from FXStreet.
FXStreet and the author do not provide personalized recommendations. The author makes no representations as to the accuracy, completeness, or suitability of this information. FXStreet and the author will not be liable for any errors, omissions or any losses, injuries or damages arising from this information and its display or use. Errors and omissions excepted.
The author and FXStreet are not registered investment advisors and nothing in this article is intended to be investment advice.
Recommended content
Editors’ Picks
EUR/USD bounces from daily lows, returns to comfort zone around 1.0750
EUR/USD bounced amid broad US Dollar weakness following the release of US employment-related data. Initial Jobless Claims unexpectedly surged in the first week of May, undermining demand for the American currency.
GBP/USD recaptures 1.2500 post-BOE as USD turns south
GBP/USD fell towards 1.2440 as the Bank of England left monetary policy unchanged, pointing to delayed yet potentially steeper rate cuts. The pair bounced nicely in the American session as an improving mood undermines demand for the US Dollar.
Gold jumps towards $2,330 on sudden USD weakness
XAU/USD trades within familiar levels but turned north early in the US session amid a sudden USD decline, resulting from discouraging US employment-related data as Initial Jobless Claims unexpectedly increased in the week ended May 3. Easing T-yields add to Gold gains.
Solana meme coins TREMP, BODEN rise after Donald Trump’s pro-crypto stance
Solana-based meme coins TREMP and BODEN post nearly 125% and 7% gains on Thursday. Former US President Donald Trump says his campaign will likely accept crypto donations.
Bank of England inches one step closer to a summer rate cut
The Bank of England is undoubtedly turning more optimistic, but it’s keeping its options open amid some uncertainty surrounding the near-term inflation numbers. We still narrowly expect the first rate cut in August.