|

USD/INR Price News: Doji around 78.6% Fibo. underpins Indian rupee pullback towards 74.00

  • USD/INR rebounds from 15-week low, following the previous day’s candlestick formation.
  • MACD conditions keep sellers hopeful till the quote stays below 74.75.
  • 200-DMA, 61.8% Fibonacci retracement challenges short-term recovery.

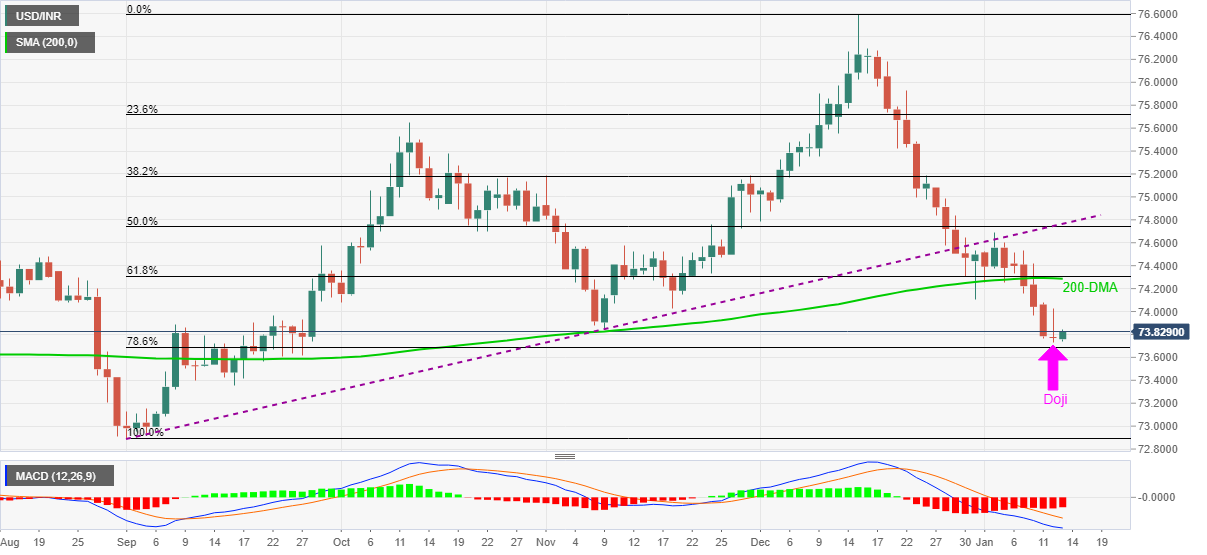
USD/INR justifies the Doji candlestick formation at a multi-day low to pick up bids to 73.84, up 0.10% intraday during early Thursday.

The trend reversal suggesting candlestick gains additional attention due to the nearness to the 78.6% Fibonacci retracement (Fibo.) level of September-December 2021 upside, near 73.67.

Even so, bearish MACD signals and sustained trading below a four-month-old support line, now resistance around 74.75, keep USD/INR sellers hopeful.

That said, the latest rebound may aim for the confluence of 200-DMA and 61.8% Fibo. level around 74.30. Also acting as the immediate resistance is the 74.00 threshold.

Meanwhile, a downside break of the 78.6% Fibonacci retracement level near 73.67 will aim for the mid-September lows near 73.35 before directing the quote to the bottoms marked in September and May, respectively around 72.90 and 72.35.

To sum up, USD/INR prices are likely to rebound but the bulls have a long way before retaking the controls.

USD/INR: Daily chart

Trend: Short-term recovery expected

Additional important levels

Overview
Today last price73.8424
Today Daily Change0.0689
Today Daily Change %0.09%
Today daily open73.7735
 
Trends
Daily SMA2074.7998
Daily SMA5074.8342
Daily SMA10074.5334
Daily SMA20074.2903
 
Levels
Previous Daily High74.0226
Previous Daily Low73.7283
Previous Weekly High74.6888
Previous Weekly Low74.1557
Previous Monthly High76.5958
Previous Monthly Low74.1065
Daily Fibonacci 38.2%73.8407
Daily Fibonacci 61.8%73.9101
Daily Pivot Point S173.6604
Daily Pivot Point S273.5472
Daily Pivot Point S373.3661
Daily Pivot Point R173.9546
Daily Pivot Point R274.1357
Daily Pivot Point R374.2488

Author

Anil Panchal

Anil Panchal

FXStreet

Anil Panchal has nearly 15 years of experience in tracking financial markets. With a keen interest in macroeconomics, Anil aptly tracks global news/updates and stays well-informed about the global financial moves and their implications.

More from Anil Panchal
Share:

Editor's Picks

EUR/USD falls to near 1.1600 due to persistent bearish bias

EUR/USD depreciates after registering modest gains in the previous session, trading around 1.1610 during the Asian hours on Thursday. The technical analysis of the daily chart suggests a persistent bearish bias as the EUR/USD pair remains within the descending channel pattern.

GBP/USD underperforms as UK faces stagflation risks amid Middle East war

The Pound Sterling trades lower against its major currency peers, is down 0.22% around 1.3340 against the US Dollar, during the Asian trade on Thursday. The British currency faces selling pressures amid fears that the United Kingdom economy could face stagflation risks due to higher energy prices, a situation in which inflation accelerates with economic growth and employment conditions remaining stagnant.

Gold climbs near $5,200 as Iran war fuels safe-haven demand

Gold price extends its gains for the second successive session on Thursday as traders seek safety amid the ongoing war in the Middle East. US and Israeli strikes across Iranian territory and widespread Iranian missile and drone retaliation across the Middle East, including attacks on regional targets and military sites, prolong the crisis and its impact.

Top Crypto Gainers: Decred, Zcash, and Dogecoin lead recovery as Bitcoin crosses $72,000

Bitcoin trades above $72,500 at press time on Thursday, holding its 6% gain from the previous day, contributing to a broader market recovery. The total cryptocurrency market capitalization stands at over $2.43 trillion as the broader market sentiment improves significantly.

First Venezuela, now Iran: The US-China energy war escalates

At first glance, the latest escalation involving the United States with both Iran and Venezuela looks like another chapter in a long-running geopolitical story. But viewed through a broader strategic lens, something else may be unfolding: Energy.

Cardano Price Analysis: Approaches key trendline amid bearish sentiment

Cardano (ADA) price is approaching its descending trendline around $0.28 at the time of writing, set to shape the next directional move. The derivatives metrics paint a bearish picture, with ADA’s Open Interest continuing to fall and short bets rising among traders.