|

USD/INR Price Analysis: Struggling to capitalize on breakout

  • USD/INR's corrective bounce has likely ended, according to technical charts.
  • The pair risks falling back to 70.80.

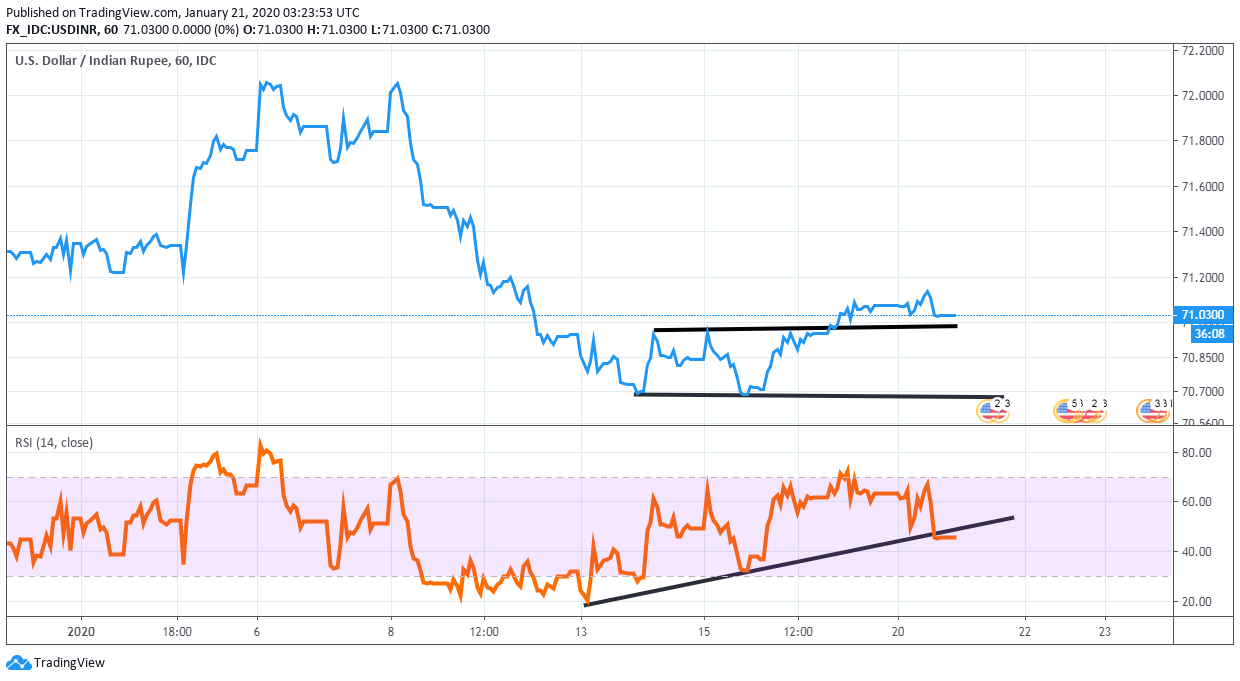
USD/INR broke higher from a sideways channel on Friday, but so far, the bulls have failed to make their presence felt. 

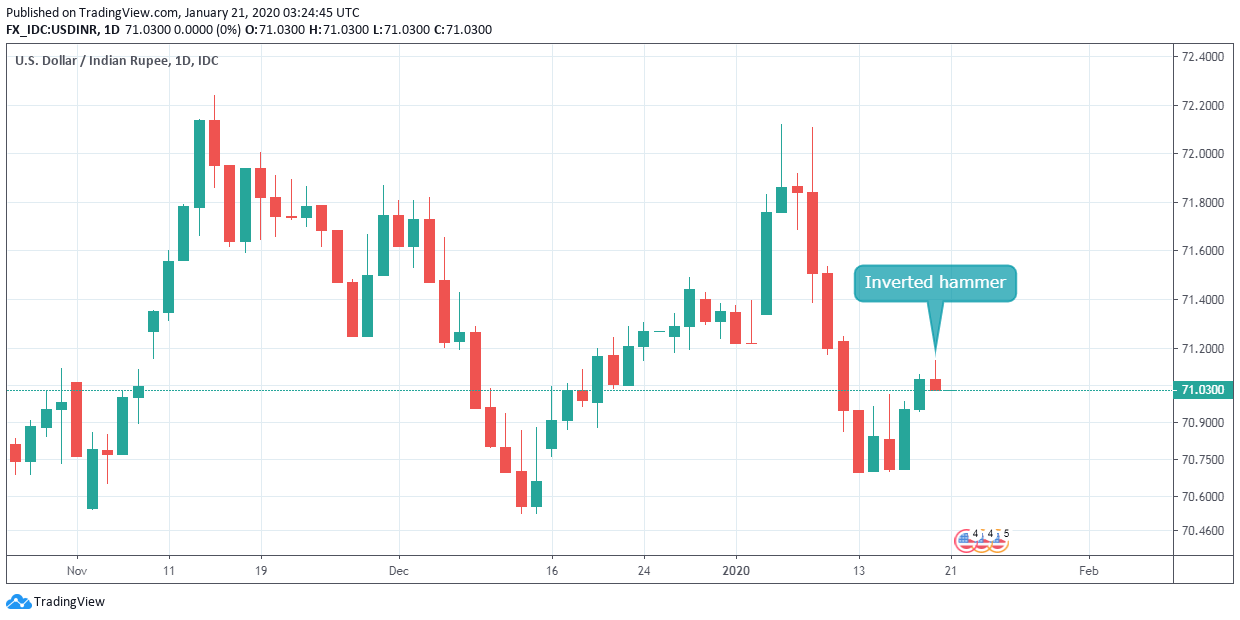
The currency pair fell by 0.10% on Monday, forming an inverted bearish hammer. That candle indicates the bounce from lows near 70.70 has likely ended. 

Further, the relative strength index (RSI) on the hourly chart has dived out of an ascending trendline. 

The pair, therefore, risks falling to support at 70.80. A violation there would expose the recent low of 70.67. 

On the higher side, 71.15 is the level to beat for the bulls.

Hourly chart

Daily chart

Trend: Bearish

Technical levels

USD/INR

Overview
Today last price71.144
Today Daily Change0.1215
Today Daily Change %0.17
Today daily open71.0225
 
Trends
Daily SMA2071.2395
Daily SMA5071.3344
Daily SMA10071.2452
Daily SMA20070.5239
 
Levels
Previous Daily High71.295
Previous Daily Low69.0705
Previous Weekly High71.27
Previous Weekly Low70.5875
Previous Monthly High71.98
Previous Monthly Low70.328
Daily Fibonacci 38.2%69.9203
Daily Fibonacci 61.8%70.4452
Daily Pivot Point S169.6303
Daily Pivot Point S268.2382
Daily Pivot Point S367.4058
Daily Pivot Point R171.8548
Daily Pivot Point R272.6872
Daily Pivot Point R374.0793


Author

Omkar Godbole

Omkar Godbole

FXStreet Contributor

Omkar Godbole, editor and analyst, joined FXStreet after four years as a research analyst at several Indian brokerage companies.

More from Omkar Godbole
Share:

Editor's Picks

GBP/USD bounces off lows, back above 1.3200

After bottoming out near 1.3160, GBP/USD manages to regain a bit of shine and reclaim the 1.3200 mark and beyond at the end of the week. Stronger-than-expected UK Retail Sales data seem to be helping the British Pound limit its losses, while the chaotic UK political environment keeps the bulls at bay for now.

EUR/USD looks consolidative around 1.1460

EUR/USD stages a modest rebound after slipping to a three-month low below 1.1420 at the end of the week. That said, the pair now looks to consolidate humble gains just above 1.1460 despite growing uncertainty surrounding the next round of US-Iran negotiations, which keeps the US Dollar’s downside contained.

Gold slips back to six-day lows, targets $4,100

Gold retreats for the third consecutive day on Friday, eroding gains seen in the first half of the week and approaching the key $4,100 mark per troy ounce. Indeed, the precious metal continues to face headwinds from the Fed's hawkish stance and renewed uncertainty surrounding the next round of US-Iran negotiations.

Solana extends correction despite ETF inflows, RWA adoption

Solana (SOL) price edges below $70 extending its losses for the fourth straight day this week. The institutional demand for Solana is building, with steady inflows so far this week and Morgan Stanley’s amended S-1 filing for a Solana-focused Exchange-Traded Fund.

The Iran war didn't break the US economy, but what happens next?

Nearly four months after the start of the Iran war, the US economy remains remarkably resilient. While the conflict initially triggered a severe disruption to global energy markets and a sharp rise in Oil prices, recent diplomatic progress between Washington and Tehran has eased concerns about a prolonged supply shock.

Regime change: Inside Kevin Warsh's first move to make the Fed unreadable on purpose

The rate did not move. That was the least interesting thing about Kevin Warsh's first meeting in charge of the Fed. The FOMC held its benchmark at 3.50%-3.75% for the fourth straight meeting, exactly as priced, and then the new chair used his first press conference to dismantle the machinery the market has leaned on for a decade.