|

USD/INR Price Analysis: Eyes 200-day SMA support

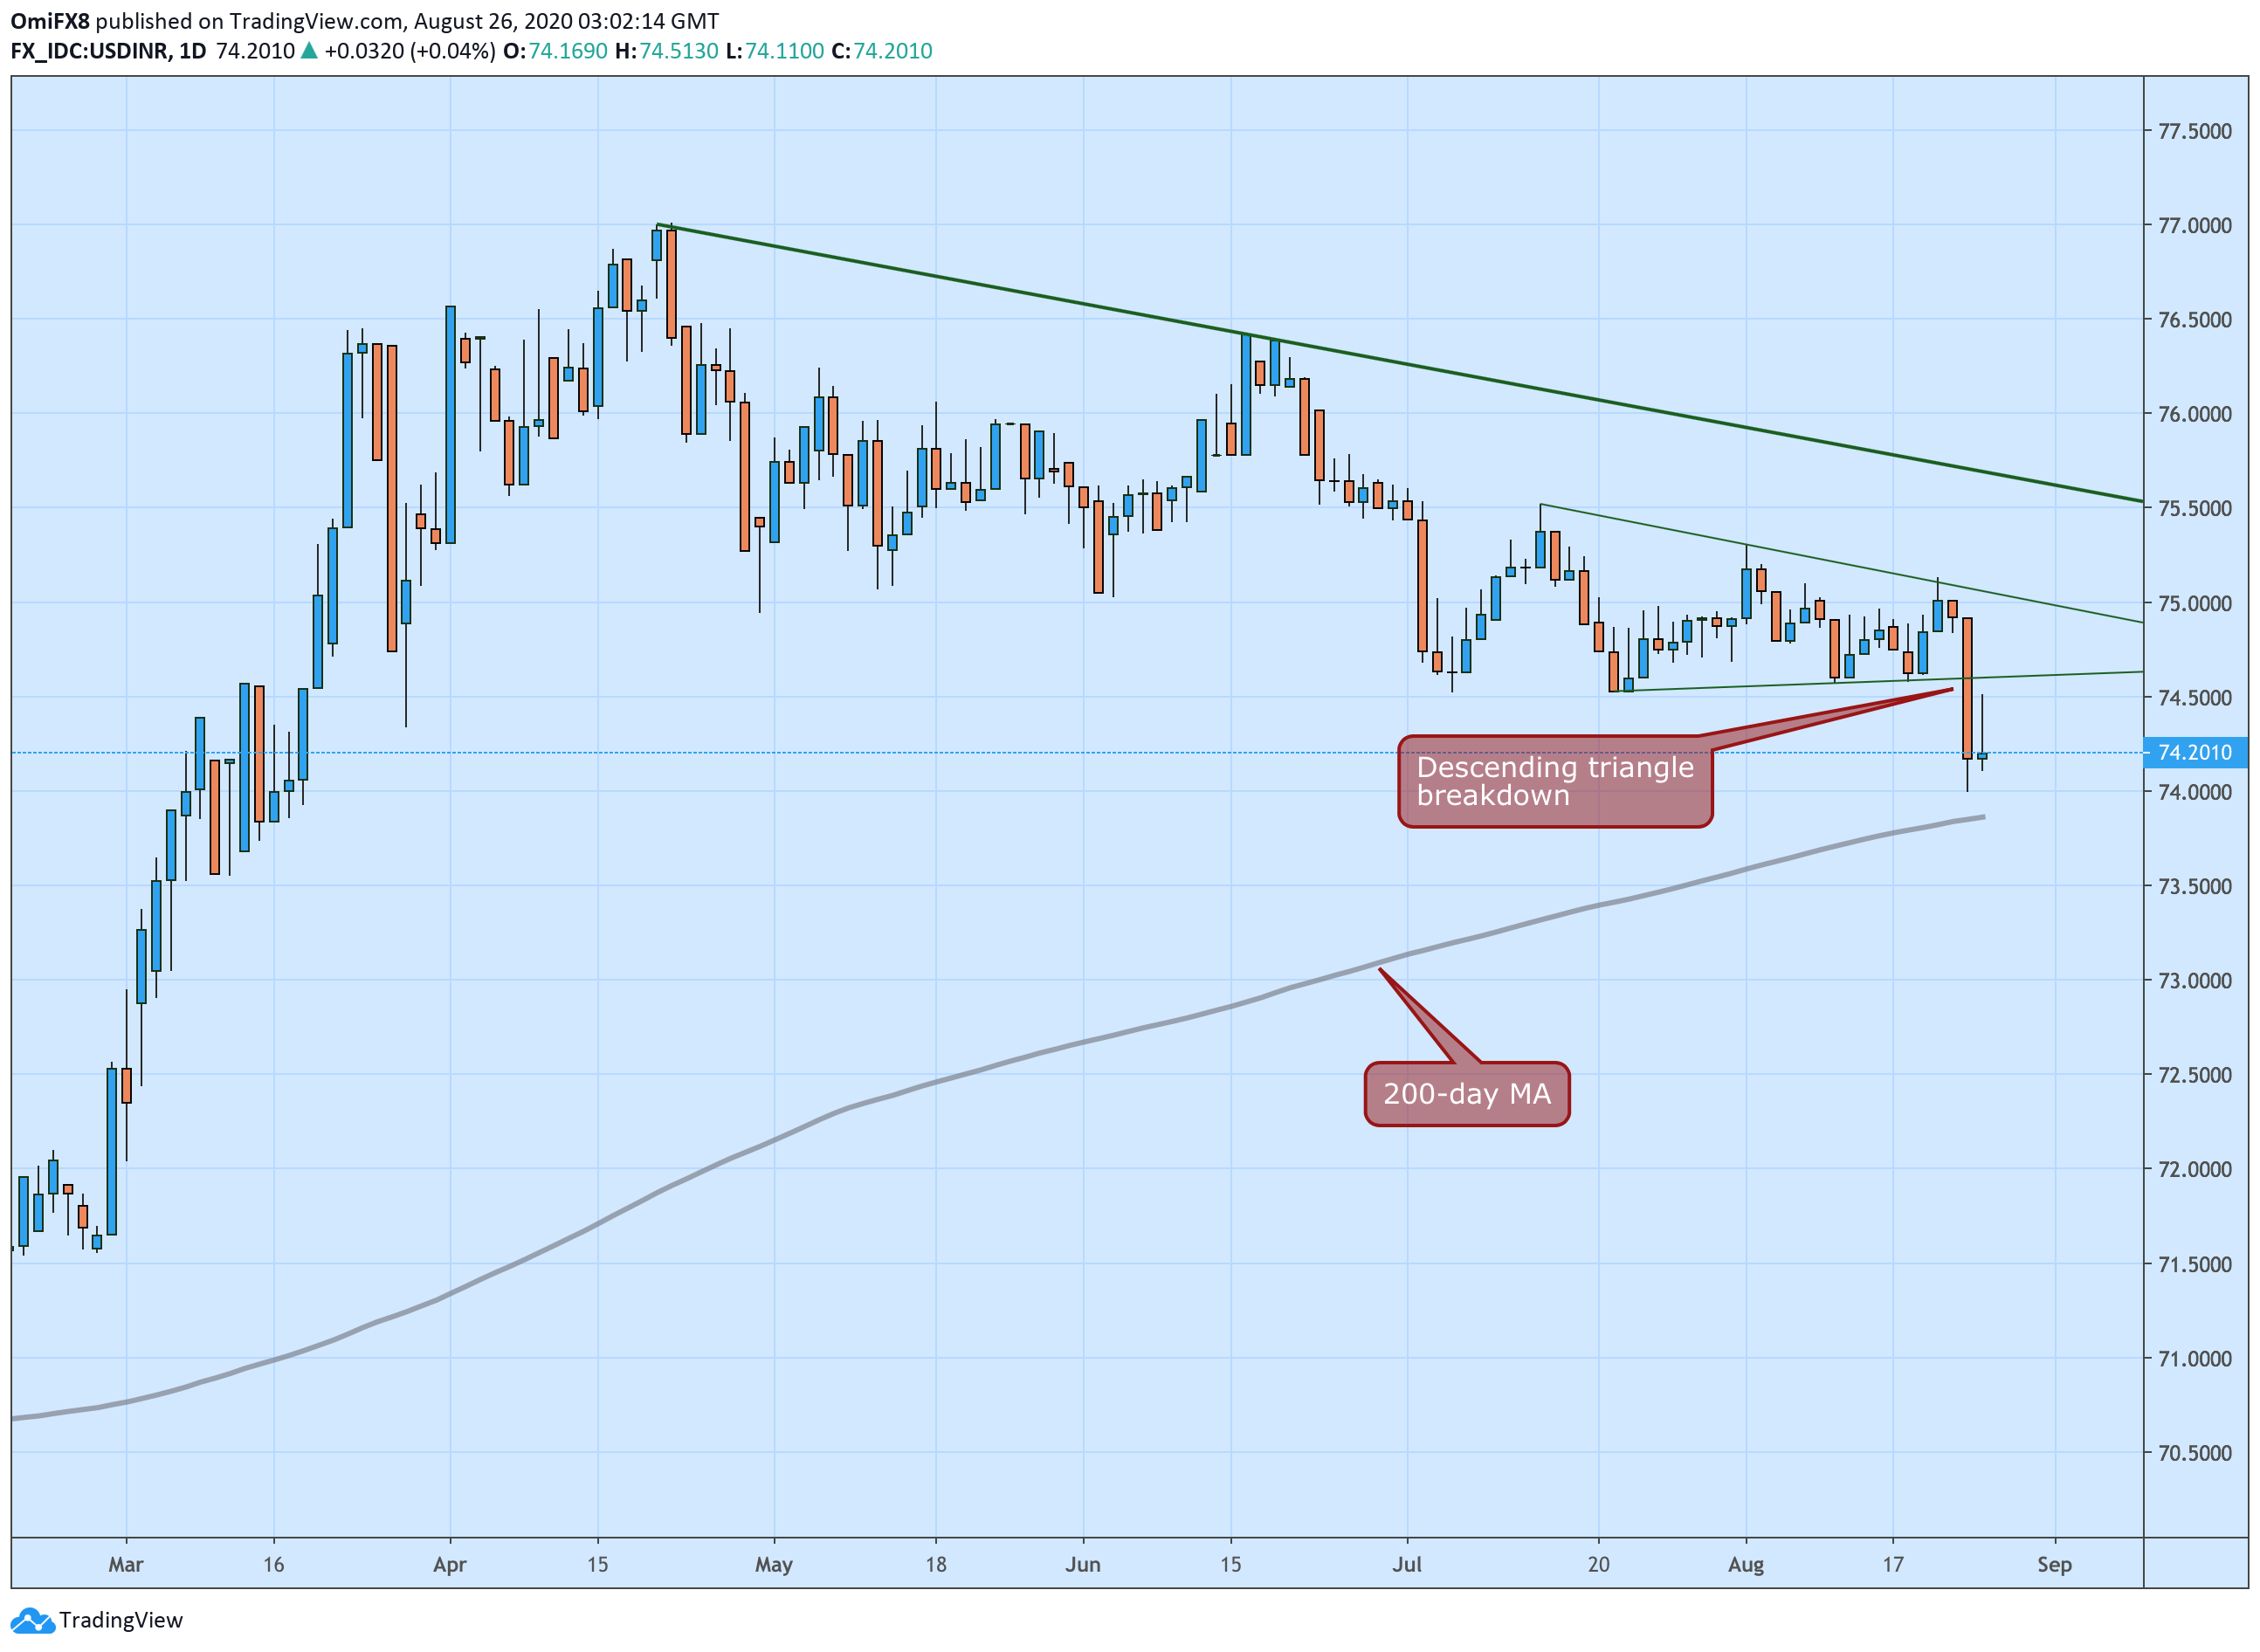
  • USD/INR's daily chart shows a descending triangle breakdown. 
  • The bearish pattern has opened the doors for test of 200-day SMA line. 

USD/INR looks south with the daily chart reporting a bearish continuation pattern. 

The pair fell by 1% on Monday – the biggest single-day decline since April 29 – confirming a downside break of a descending triangle pattern on the daily chart. 

The breakdown gained credence on Tuesday as the buyers failed to penetrate the former support-turned-hurdle at 74.50 and indicates that the sell-off from highs near 77.00 seen in April has resumed. 

As such, the 200-day simple moving average (SMA), currently at 73.86, could soon come into play. 

Supporting the bearish case is the below-50 reading on the 14-day relative strength index and the slow stochastic indicator. 

A close above Monday’s high of 74.92 is needed to invalidate the bearish outlook

Daily chart

Trend: Bearish

Technical levels

USD/INR

Overview
Today last price74.2325
Today Daily Change-0.0023
Today Daily Change %-0.00
Today daily open74.2348
 
Trends
Daily SMA2074.8226
Daily SMA5075.0627
Daily SMA10075.4534
Daily SMA20073.8733
 
Levels
Previous Daily High74.475
Previous Daily Low74.0705
Previous Weekly High75.1452
Previous Weekly Low74.559
Previous Monthly High75.6224
Previous Monthly Low74.5052
Daily Fibonacci 38.2%74.3205
Daily Fibonacci 61.8%74.225
Daily Pivot Point S174.0452
Daily Pivot Point S273.8556
Daily Pivot Point S373.6407
Daily Pivot Point R174.4497
Daily Pivot Point R274.6646
Daily Pivot Point R374.8542

Author

Omkar Godbole

Omkar Godbole

FXStreet Contributor

Omkar Godbole, editor and analyst, joined FXStreet after four years as a research analyst at several Indian brokerage companies.

More from Omkar Godbole
Share:

Editor's Picks

EUR/USD meets initial support around 1.1800

EUR/USD remains on the back foot, although it has managed to reverse the initial strong pullback toward the 1.1800 region and regain some balance, hovering around the 1.1850 zone as the NA session draws to a close on Tuesday. Moving forward, market participants will now shift their attention to the release of the FOMC Minutes and US hard data on Wednesday.
 

GBP/USD bounces off lows, retargets 1.3550

After bottoming out just below the 1.3500 yardstick, GBP/USD now gathers some fresh bids and advances to the 1.3530-1.3540 band in the latter part of Tuesday’s session. Cable’s recovery comes as the Greenback surrenders part of its advance, although it keeps the bullish bias well in place for the day.

Gold remains offered below $5,000

Gold stays on the defensive on Tuesday, receding to the sub-$5,000 region per troy ounce on the back of the persistent move higher in the Greenback. The precious metal’s decline is also underpinned by the modest uptick in US Treasury yields across the spectrum.

Ethereum Price Forecast: BitMine extends ETH buying streak, says long-term outlook remains positive

Ethereum (ETH) treasury firm BitMine Immersion continued its weekly purchase of the top altcoin last week after acquiring 45,759 ETH.

UK jobs market weakens, bolstering rate cut hopes

In the UK, the latest jobs report made for difficult reading. Nonetheless, this represents yet another reminder for the Bank of England that they need to act swiftly given the collapse in inflation expected over the coming months. 

Ripple slides to $1.45 as downside risks surge

Ripple edges lower at the time of writing on Tuesday, from the daily open of $1.48, as headwinds persist across the crypto market. A short-term support is emerging at $1.45, but a buildup of bearish positions could further weaken the derivatives market and prolong the correction.