USD/INR Price Analysis: Bulls step in at critcal daily support
- USD/INR bulls target a deeper test of the weekly supply zone.
- Hourly resistance is the first hurdle as bulls step in at daily support.

USD/INR, in a top-down analysis, is offering a case for both the bulls and the bears, but the conclusion arrives at a bullish bias for the meantime, if not the medium term.
Weekly chart
-637617139270442915.png)
The weekly chart shows that the bulls are pressing against a firm resistance area in the 74.87s and a correction to the downside would be expected, in due course.
Daily chart
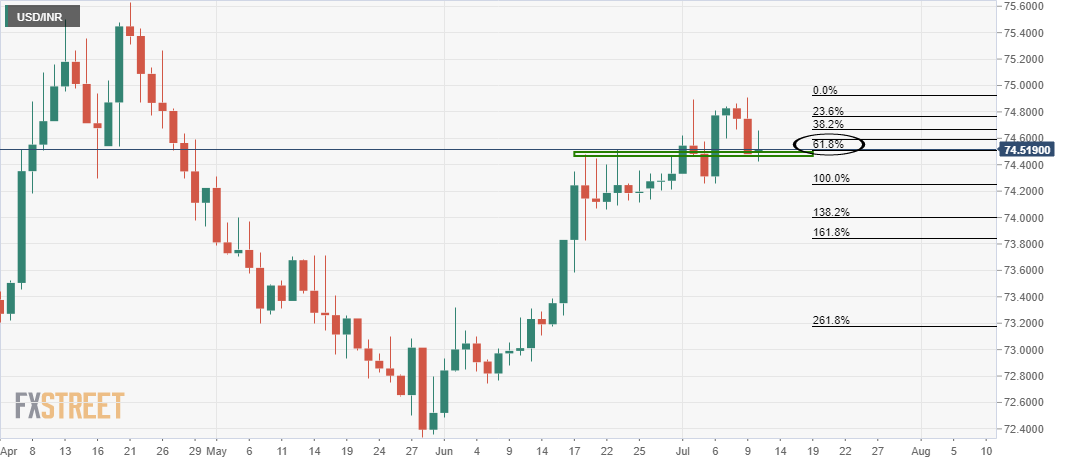
The daily chart, however, shows that the price has already met the daily support structure and the confluence of the 61.8% Fibonacci resistance.
This, therefore, leaves a bullish bias for the meanwhile and prospects of an extension to the upside, in line with the broader bullish trend.
Hourly chart
-637617140261992805.png)
From an hourly perspective, there is an immediate resistance structure in the 74.5680s to get through first, but on achieving that, the bulls will have higher highs in their sights for deeper penetration of the weekly supply zone:
Back the weekly chart
-637617141993566480.png)
Author

Ross J Burland
FXStreet
Ross J Burland, born in England, UK, is a sportsman at heart. He played Rugby and Judo for his county, Kent and the South East of England Rugby team.


