USD/CNH Price Analysis: Trades with modest intraday gains, 50-day SMA holds the key for bulls


  • USD/CNH edges higher on Monday and climbs closer to a multi-day-old trading range hurdle.
  • The mixed technical setup warrants caution before positioning for a further appreciating move.
  • A convincing break below the 50-day SMA is needed to support prospects for a meaningful fall.

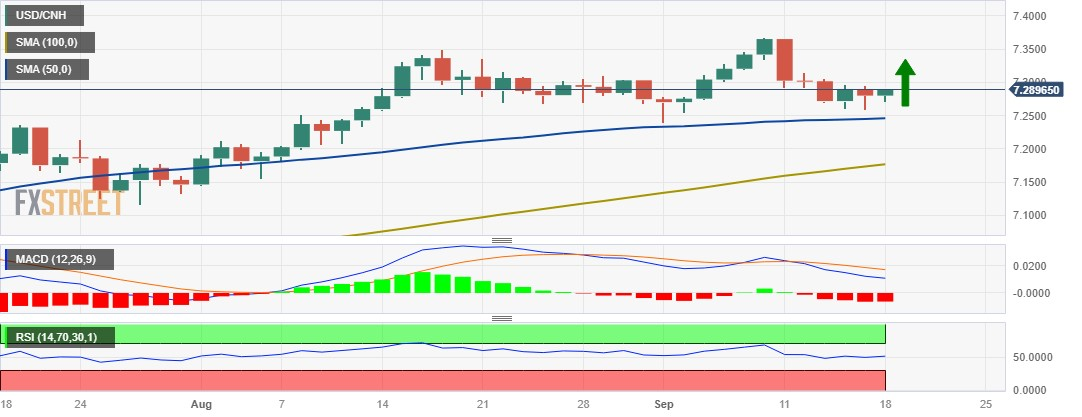
The USD/CNH pair builds on Friday's modest rebound from the 7.2595 region, or a nearly two-week low and gains some positive traction during the Asian session on Monday. Spot prices currently trade around the 7.2905 area, up over 0.10% for the day, flirting with the top boundary of a three-day-old range.

Looking at the broader picture, the USD/CNH pair is holding comfortably above technically significant 50-day, 100-day and 200-day Simple Moving Averages (SMAs), which, in turn, favours bullish traders. That said, oscillators on the daily chart are yet to confirm a bullish bias and warrant some caution before positioning for any meaningful appreciating move. Hence, any subsequent strength is more likely to confront a stiff barrier near the 7.3040-7.3050 region.

This is closely followed by resistance near the 7.3105 area, which if cleared should lift the USD/CNH pair towards the next relevant hurdle near the 7.3360-7.3365 region en route to the 7.3495 zone. Some follow-through buying beyond the 7.3500 mark should allow spot prices to challenge a multi-year peak, around the 7.3680-7.3685 region touched on September 8, which if cleared decisively will be seen as a fresh trigger for bullish traders.

On the flip side, the 7.2700 level now seems to protect the immediate downside ahead of Friday's low, around the 7.2595 zone and the 50-day SMA, currently pegged around the 7.2435 zone. A convincing break below the latter could prompt aggressive technical selling and drag the USD/CNH pair below the monthly low, around the 7.2390 region, towards testing the next relevant support near the 7.2135-7.2130 region.

USD/CNH daily chart

fxsoriginal

Technical levels to watch

USD/CNH

Overview
Today last price 7.2884
Today Daily Change 0.0084
Today Daily Change % 0.12
Today daily open 7.28
 
Trends
Daily SMA20 7.2969
Daily SMA50 7.2449
Daily SMA100 7.1734
Daily SMA200 7.025
 
Levels
Previous Daily High 7.2952
Previous Daily Low 7.2596
Previous Weekly High 7.3652
Previous Weekly Low 7.2596
Previous Monthly High 7.3496
Previous Monthly Low 7.1452
Daily Fibonacci 38.2% 7.2732
Daily Fibonacci 61.8% 7.2817
Daily Pivot Point S1 7.2614
Daily Pivot Point S2 7.2427
Daily Pivot Point S3 7.2258
Daily Pivot Point R1 7.297
Daily Pivot Point R2 7.3139
Daily Pivot Point R3 7.3326


Share: Feed news

Information on these pages contains forward-looking statements that involve risks and uncertainties. Markets and instruments profiled on this page are for informational purposes only and should not in any way come across as a recommendation to buy or sell in these assets. You should do your own thorough research before making any investment decisions. FXStreet does not in any way guarantee that this information is free from mistakes, errors, or material misstatements. It also does not guarantee that this information is of a timely nature. Investing in Open Markets involves a great deal of risk, including the loss of all or a portion of your investment, as well as emotional distress. All risks, losses and costs associated with investing, including total loss of principal, are your responsibility. The views and opinions expressed in this article are those of the authors and do not necessarily reflect the official policy or position of FXStreet nor its advertisers. The author will not be held responsible for information that is found at the end of links posted on this page.

If not otherwise explicitly mentioned in the body of the article, at the time of writing, the author has no position in any stock mentioned in this article and no business relationship with any company mentioned. The author has not received compensation for writing this article, other than from FXStreet.

FXStreet and the author do not provide personalized recommendations. The author makes no representations as to the accuracy, completeness, or suitability of this information. FXStreet and the author will not be liable for any errors, omissions or any losses, injuries or damages arising from this information and its display or use. Errors and omissions excepted.

The author and FXStreet are not registered investment advisors and nothing in this article is intended to be investment advice.

Recommended content


Recommended content

Editors’ Picks

AUD/USD going nowhere in a hurry; remains stuck in a multi-week-old range

AUD/USD going nowhere in a hurry; remains stuck in a multi-week-old range

AUD/USD extends the range play on Friday and remains below the 200-day SMA pivotal resistance as the RBA's dovish outlook and renewed US-China trade tensions undermine the Aussie amid a modest USD recovery. However, Fed rate cut bets cap the upside for the USD, which, along with a positive risk tone, acts as a tailwind for the currency pair.

USD/JPY ticks lower as Japan’s strong inflation print lifts BoJ rate hike bets

USD/JPY ticks lower as Japan’s strong inflation print lifts BoJ rate hike bets

USD/JPY attracts fresh sellers during the Asian session on Friday following the release of hot consumer inflation figures from Japan, which keeps the door open for more interest rate hikes by the BoJ. Moreover, trade uncertainties and geopolitical risks underpin the JPY and weigh on the currency pair amid the lack of follow-through USD buying. 

Gold trades with mild positive bias below two-week top set on Thursday

Gold trades with mild positive bias below two-week top set on Thursday

Gold price edges higher following the previous day's pullback from a two-week high amid a combination of supporting factors. Concerns about the US economic growth and fiscal health, along with renewed US-China trade tensions and geopolitical risks, benefit the XAU/USD's safe-haven status. Moreover, subdued USD price action and Fed rate cut bets support the non-yielding yellow metal.

TRUMP meme coin sees rejection at $16, legislators target President Trump's crypto ties ahead of gala with holders

TRUMP meme coin sees rejection at $16, legislators target President Trump's crypto ties ahead of gala with holders

Official Trump (TRUMP) meme coin saw a rejection at $16 on Thursday ahead of a crypto dinner between token holders and President Trump. The dinner comes amid backlash from lawmakers who introduced the Stop TRUMP in Crypto Act to halt the President's involvement in digital assets.

FOMO vs fundamentals: Retail buys the dip, institutional investors stay cautious

FOMO vs fundamentals: Retail buys the dip, institutional investors stay cautious

Retail optimism is rising, but institutions are still treading carefully amid lingering macro and earnings risks. Policy and fiscal uncertainty remain elevated, with trade tensions, U.S. debt concerns, and a cautious Fed dominating the backdrop.

The Best brokers to trade EUR/USD

The Best brokers to trade EUR/USD

SPONSORED Discover the top brokers for trading EUR/USD in 2025. Our list features brokers with competitive spreads, fast execution, and powerful platforms. Whether you're a beginner or an expert, find the right partner to navigate the dynamic Forex market.

Forex MAJORS

Cryptocurrencies

Signatures

Best Brokers of 2025