|

USD/CNH Price Analysis: Pair extends the gains, hovers below 7.3590 resistance confluence

  • USD/CNH extends its gains due to the firmer US Dollar (USD) following the consistent stream of upbeat economic data.
  • Momentum indicators indicate a favorable upward trend in the short-term trajectory.
  • Chinese President Xi Jinping will not attend the G20 leaders' summit in New Delhi.
USD/CNH Price Analysis: Pair extends the gains, hovers below 7.3590 resistance confluence

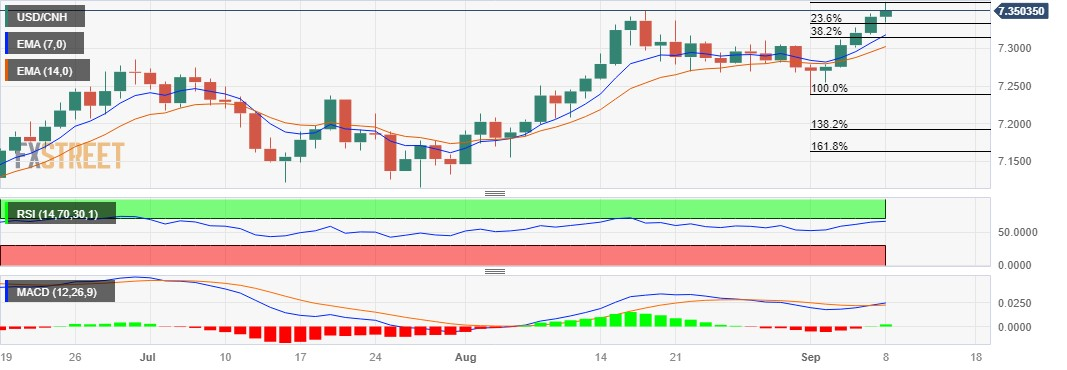
USD/CNH continues the winning streak for the fifth day during the Asian session on Friday, trading around 7.3530 aligned to the 7.3590 resistance confluence. Meanwhile, the onshore Yuan (CNY) has marked a 16-year high at 7.3462 vs. the US Dollar (USD). The pair is experiencing upward support due to the firmer Greenback following the consistent stream of upbeat economic data from the United States (US).

On Thursday, the United States (US) released data indicating that as of September 1, US Initial Jobless Claims stood at 216,000, which is a decrease from the previous figure of 229,000. Market expectations had anticipated an increase to 234,000. Additionally, US Unit Labor Costs for the second quarter (Q2) rose to 2.2%, up from the previous reading of 1.6%, contrary to the expectation that it would remain unchanged.

Moreover, the G20 leaders' summit is scheduled to kick off in New Delhi this coming Saturday. It is worth highlighting that US President Joe Biden will participate in the event, while Chinese President Xi Jinping will not be in attendance. This situation is likely to add to the existing strain on the already delicate and deteriorating relationship between the two superpowers.

The Moving Average Convergence Divergence (MACD) line stays above the centerline and lies above the signal line. This configuration indicates that the recent momentum is relatively robust and in an upward direction.

On the downside, the pair could meet the support around 23.6% Fibonacci retracement at 7.3325 level. A firm break below the latter could push the USD/CNH pair to navigate the region around the seven-day Exponential Moving Average (EMA) at 7.3188 aligned to the 38.2% Fibonacci retracement at 7.3146, following the 14-day EMA at 7.3029.

In the near future, the USD/CNH pair is expected to maintain its bullish stance, contingent upon the 14-day Relative Strength Index (RSI) remaining above the 50 level.

USD/CNH: Daily Chart
USD/CNH: additional important levels

Overview
Today last price7.3532
Today Daily Change0.0114
Today Daily Change %0.16
Today daily open7.3418
 
Trends
Daily SMA207.2968
Daily SMA507.2386
Daily SMA1007.1507
Daily SMA2007.0153
 
Levels
Previous Daily High7.346
Previous Daily Low7.3188
Previous Weekly High7.3106
Previous Weekly Low7.239
Previous Monthly High7.3496
Previous Monthly Low7.1452
Daily Fibonacci 38.2%7.3357
Daily Fibonacci 61.8%7.3292
Daily Pivot Point S17.3251
Daily Pivot Point S27.3084
Daily Pivot Point S37.2979
Daily Pivot Point R17.3523
Daily Pivot Point R27.3628
Daily Pivot Point R37.3795

Author

Akhtar Faruqui

Akhtar Faruqui is a Forex Analyst based in New Delhi, India. With a keen eye for market trends and a passion for dissecting complex financial dynamics, he is dedicated to delivering accurate and insightful Forex news and analysis.


More from Akhtar Faruqui
Share:

Editor's Picks

AUD/USD bears retain control near YTD low, 0.6650 tested

AUD/USD sits at fresh YTD lows near 0.6550 in Friday's Asian session and looks vulnerable to further downside. The US Dollar holds near April 2025 highs amid renewed US-Iran tensions and aggressive Fed rate-hike bets. Moreover, Thursday’s dismal Aussie jobs data, the RBA’s dovish tilt and PBOC's status-quo continue to weigh on the Aussie, validating the negative outlook for the currency pair.

USD/JPY drops below 159.50 after Japan’s National CPI

USD/JPY has turned south below mid-159.00s in the Asian session on Friday, as the Japanese Yen gains ground following the country's National CPI, which reaffirmed the December BoJ rate hike. Further, a broader risk-off market environment lifts the Yen's safe-haven appeal. However, hawkish Fed outlook and renewed US-Iran tensions keep the US Dollar supported, which could limit the pair's downside.


Gold: The $3,500 zone holds the downside… for now

Gold further extends its deep pullback, coming close to the key $3,500 mark per troy ounce as Friday’s European session draws to a close. Furthermore, the yellow metal has traded with losses since Monday, always tracking rising bets for extra tightening by the Fed and the lack of any progress from the Middle East conflict.

Bitcoin slips below $60,000 as selling pressure accelerates

Bitcoin price slips below $60,000 on Friday, reaching a level not seen since early July. Momentum indicators suggest firm selling pressure despite reaching oversold levels.

Week ahead – Flash PMIs and PCE inflation in focus ahead of Thanksgiving

US flash PMIs and PCE inflation data could shape Fed rate expectations. Eurozone and UK PMIs will offer an early look at business activity. Australia’s CPI data could influence expectations for the RBA’s next move.

Gold's 14-month low looks mild next to Silver's fall from $121 to $44
Gold has lost a third of its value since January as traders bet on more Federal Reserve rate increases. Silver has lost nearly two-thirds, because the buyers still holding Gold up have no equivalent in the Silver market. Gold is trading below $3,700 for the first time since September 2025, a little more than a third under the record near $5,600 it set in late January.















