USD/CNH Price Analysis: Hits 7-month low, indicators show oversold conditions
- USD/CNH slips to seven-month low amid oversold readings on key indicators.
- Daily candlesticks suggests the bearish sentiment is quite strong.

USD/CNH fell to 6.8760 early Thursday – the lowest level since Jan. 21. At press time, the pair is trading near 6.8790 – down 4.4% from the high of 7.1964 observed on May 27.
The daily chart slow stochastic indicator is now reporting oversold conditions with a below-20 ;print. The 14-day relative strength index, too, has dipped into oversold territory below 30.
Even so, it is too early to call bearish exhaustion. That’s because there are no signs of seller exhaustion on the daily chart. In fact, the daily chart shows the opposite. The pair created a bearish marubozu candle on Wednesday – a sign the bears are in control.
As such, the path of least resistance remains to the downside.
The trend, however, will likely turn bullish if Federal Reserve’s Chairman Jerome Powell does not signal tolerance for above-target inflation during this speech at the Jackson Hole Symposium on Thursday.
The central bank has mostly missed its 2% inflation target over the past eight years. Further, the US economy suffered a record contraction in the second quarter, courtesy of the coronavirus outbreak.
Hence, markets are convinced that the central bank would adopt a more relaxed approach to inflation and allow price pressures to rise above the target.
Daily chart
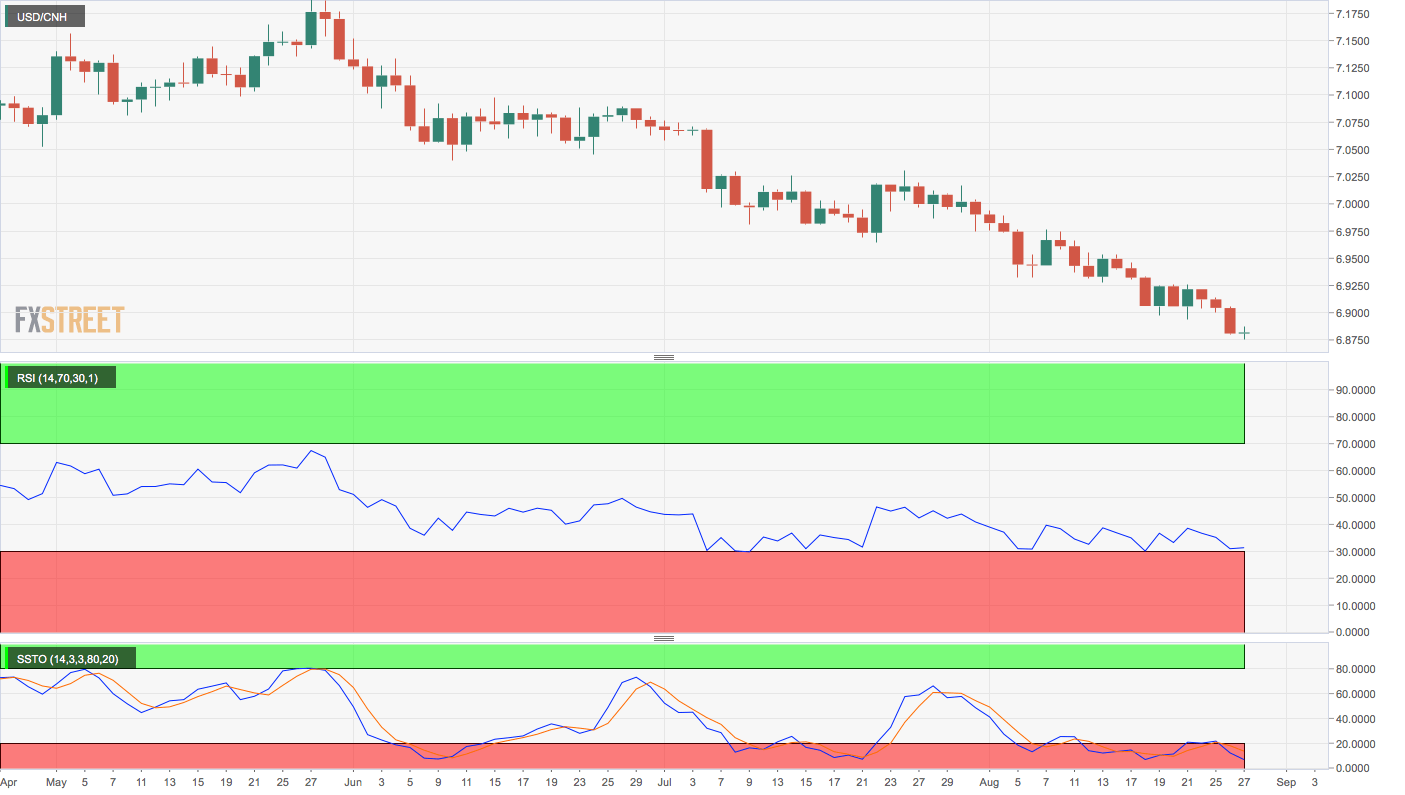
Trend: Bearish
Technical levels
Author

Omkar Godbole
FXStreet Contributor
Omkar Godbole, editor and analyst, joined FXStreet after four years as a research analyst at several Indian brokerage companies.


