USD/CHF Technical Analysis: Greenback bulls remain in charge above the 0.9800 level
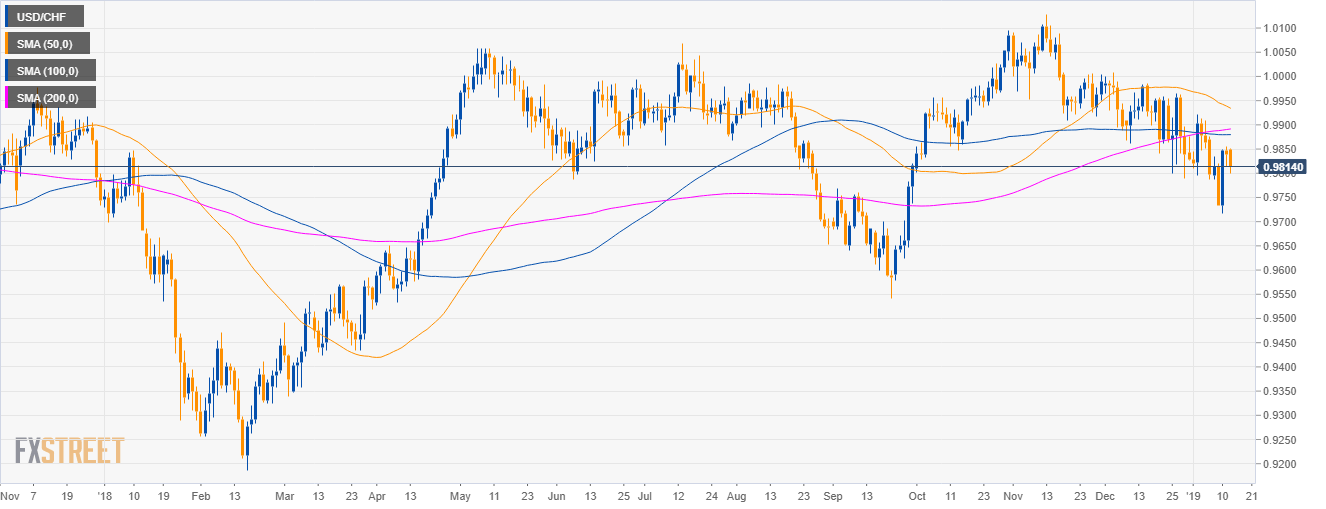
USD/CHF daily chart
- USD/CHF is trading in a sideways trend below the 50, 100 and 200-period simple moving average (SMA).
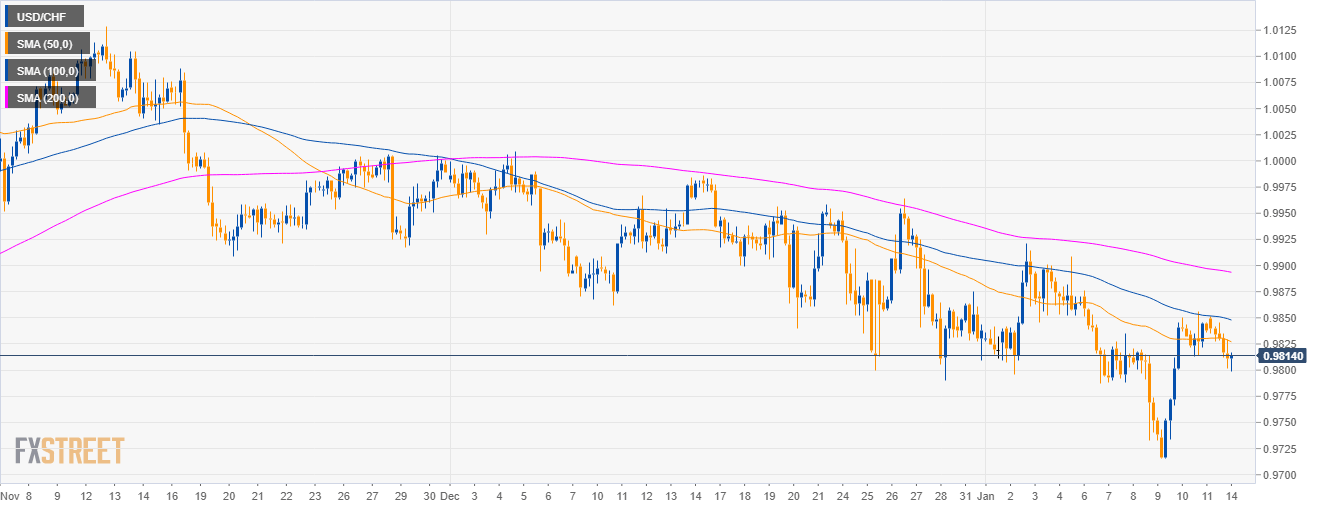
USD/CHF 4-hour chart
- The market is rejecting the 50 and 100 SMA.
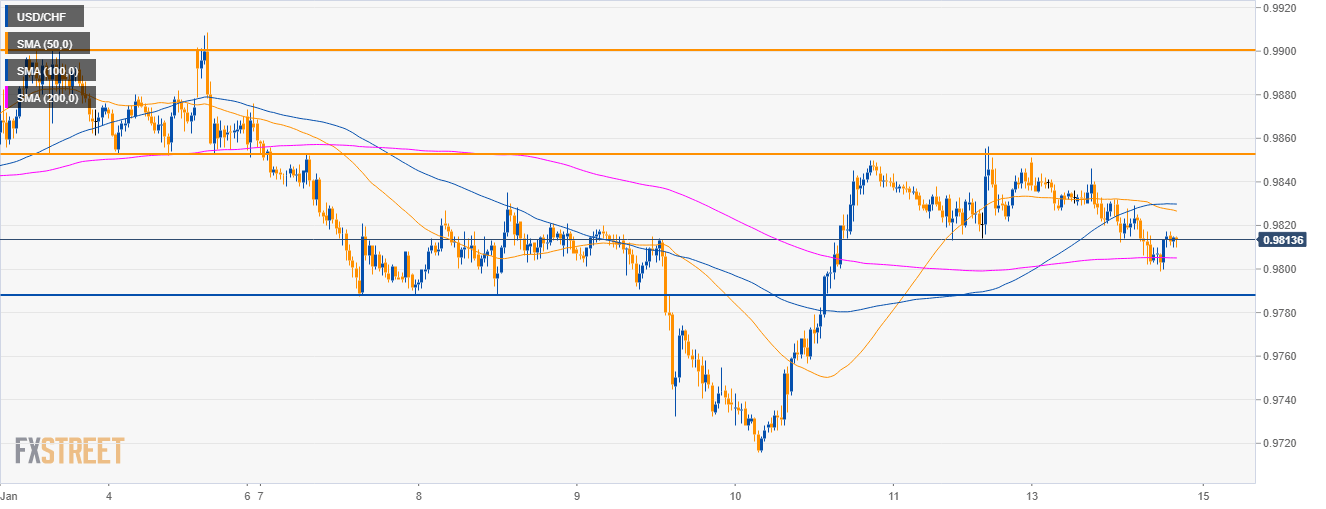
USD/CHF 30-minute chart
- USD/CAD is trading above its 200 SMA.
- USD bulls are likely in charge as the next objective is to retest 0.9850 and then break to 0.9900 figure if the buyers gather enough steam.
- Support is seen near the 0.9790 level.
Additional key levels
USD/CHF
Overview:
Today Last Price: 0.9814
Today Daily change: -24 pips
Today Daily change %: -0.244%
Today Daily Open: 0.9838
Trends:
Previous Daily SMA20: 0.9868
Previous Daily SMA50: 0.9939
Previous Daily SMA100: 0.988
Previous Daily SMA200: 0.9888
Levels:
Previous Daily High: 0.9856
Previous Daily Low: 0.9813
Previous Weekly High: 0.9876
Previous Weekly Low: 0.9716
Previous Monthly High: 1.0009
Previous Monthly Low: 0.979
Previous Daily Fibonacci 38.2%: 0.983
Previous Daily Fibonacci 61.8%: 0.984
Previous Daily Pivot Point S1: 0.9815
Previous Daily Pivot Point S2: 0.9793
Previous Daily Pivot Point S3: 0.9772
Previous Daily Pivot Point R1: 0.9859
Previous Daily Pivot Point R2: 0.9879
Previous Daily Pivot Point R3: 0.9902
Author

Flavio Tosti
Independent Analyst


