USD/CHF Price Analysis: Sellers attack a three-week-old support line below 0.9500
- USD/CHF recedes from intraday high of 0.9465.
- Multiple Doji candlesticks around the key support line portray the traders’ indecision, Bearish MACD keeps sellers hopeful.
- 100-bar EMA, 61.8% Fibonacci retracement limits the pair’s near-term upside.
USD/CHF registers another pullback from 0.9465/64 area while declining to 0.9458 during the pre-European session on Thursday. While a short-term support line stretched from June 11 currently questions the sellers, bearish MACD signals and sustained trading below 100-bar EMA suggests further downside of the quote.
Hence, traders should wait for a clear downside break of the said support line, currently around 0.9455, to aim for June 23 low near 0.9420 and 0.9400 round-figures.
However, June month bottom near 0.9375 will be the tough nut to crack for the pair sellers past-0.9400.
Alternatively, short-term buyers will look for entries beyond the 100-bar EMA level of 0.9501. In doing so, the June-end top near 0.9533 and 61.8% Fibonacci retracement of June-05-11 fall, around 0.9550, could be on their radars.
In a case where the bulls dominate past-0.9550, 0.9590 and 0.9600 could offer intermediate halts during the run-up to 0.9650.
USD/CHF four-hour chart
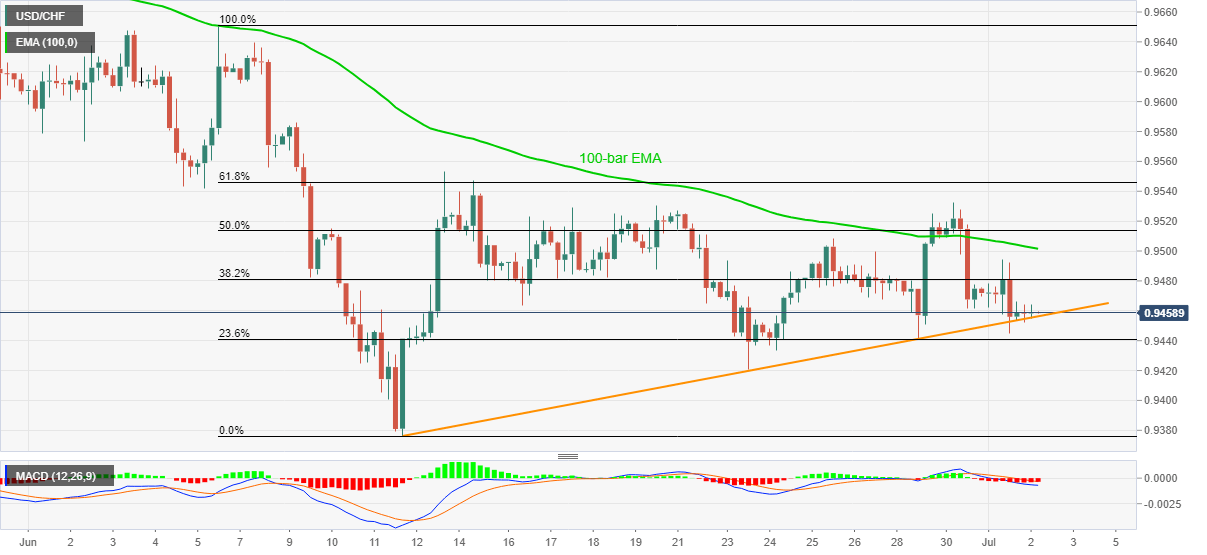
Trend: Further downside expected
Author

Anil Panchal
FXStreet
Anil Panchal has nearly 15 years of experience in tracking financial markets. With a keen interest in macroeconomics, Anil aptly tracks global news/updates and stays well-informed about the global financial moves and their implications.


