NZD/USD slides after RBNZ pushes back on rate hike expectations
- RBNZ held at 2.25% as expected, but Governor Breman's dovish forward guidance triggered a sharp New Zealand Dollar sell-off
- The Reserve Bank of New Zealand (RBNZ) held the Official Cash Rate (OCR) at 2.25% on Wednesday and pushed the first potential hike to late 2026 or early 2027, well behind market pricing for near-term tightening.
- New Zealand January trade balance data on Thursday and RBNZ Governor Breman's speech later in the session will provide further clarity on the policy outlook; US initial jobless claims and Fed speakers Bostic, Bowman, and Kashkari are also on the calendar.

The RBNZ held the OCR steady as markets widely expected on Wednesday, but the tone was the market mover. Governor Breman's updated forecast positioned the first potential rate increase much later than markets had priced by year end, triggering a sharp sell-off in the New Zealand Dollar (NZD) across the board. The dovish guidance stands in contrast to the RBA's hawkish stance following its February rate hike to 3.85%, opening a clear policy divergence between the two Antipodean central banks. New Zealand's consumer inflation at 3.1% YoY remains above the RBNZ's target midpoint but is not accelerating, giving policymakers room to stay on hold. Late Thursday's trade balance data and Governor Breman's speech will be watched for any nuance on the economic outlook.
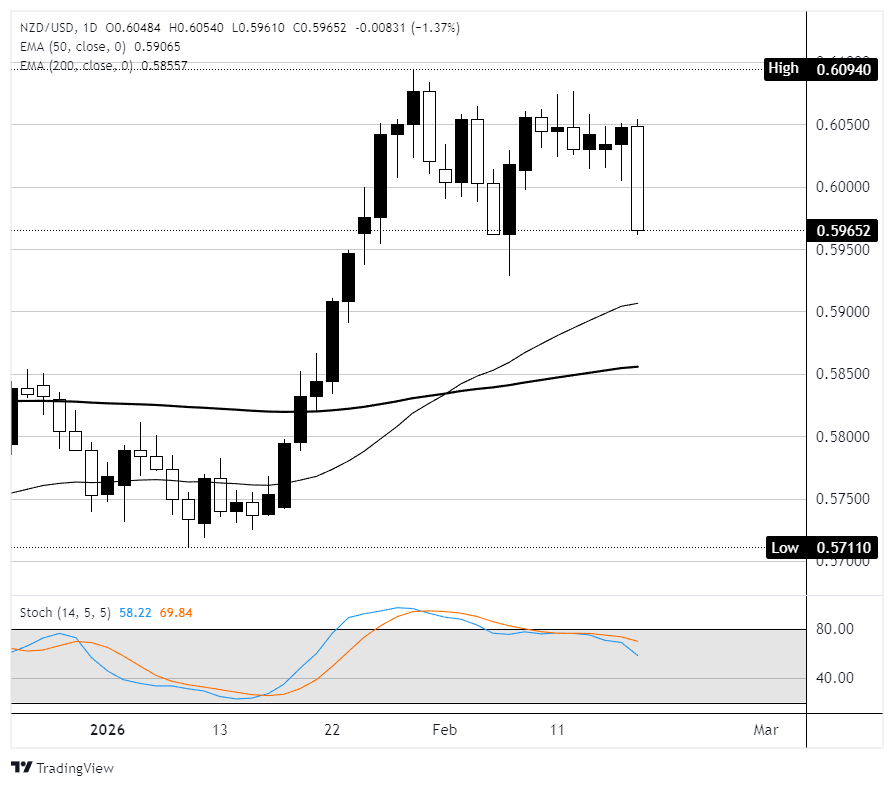
Bearish daily candle breaks below 0.6000 as Stochastic turns lower from upper zone
On the daily chart, NZD/USD opened Wednesday near 0.6050 before promptly tumbling 1.35% Through the day. The sell-off produced a large bearish candle that has broken below the 0.6000 psychological level and erased most of two weeks' worth of gains. Despite the drop, price is still holding above the 50-day EMA just north of 0.5900 and well clear of the 200-day EMA near 0.5850, so the broader uptrend from the November low near 0.5580 is still in play. The Stochastic Oscillator has crossed bearish from the upper zone, suggesting momentum has shifted to the downside in the near term. Immediate support rests at the 50-day EMA near 0.5907; a break below would target 0.5850 and the 200-day EMA. Resistance now sits at 0.6000, with the year-to-date high at 0.6094 above.
NZD/USD daily chart
New Zealand Dollar FAQs
The New Zealand Dollar (NZD), also known as the Kiwi, is a well-known traded currency among investors. Its value is broadly determined by the health of the New Zealand economy and the country’s central bank policy. Still, there are some unique particularities that also can make NZD move. The performance of the Chinese economy tends to move the Kiwi because China is New Zealand’s biggest trading partner. Bad news for the Chinese economy likely means less New Zealand exports to the country, hitting the economy and thus its currency. Another factor moving NZD is dairy prices as the dairy industry is New Zealand’s main export. High dairy prices boost export income, contributing positively to the economy and thus to the NZD.
The Reserve Bank of New Zealand (RBNZ) aims to achieve and maintain an inflation rate between 1% and 3% over the medium term, with a focus to keep it near the 2% mid-point. To this end, the bank sets an appropriate level of interest rates. When inflation is too high, the RBNZ will increase interest rates to cool the economy, but the move will also make bond yields higher, increasing investors’ appeal to invest in the country and thus boosting NZD. On the contrary, lower interest rates tend to weaken NZD. The so-called rate differential, or how rates in New Zealand are or are expected to be compared to the ones set by the US Federal Reserve, can also play a key role in moving the NZD/USD pair.
Macroeconomic data releases in New Zealand are key to assess the state of the economy and can impact the New Zealand Dollar’s (NZD) valuation. A strong economy, based on high economic growth, low unemployment and high confidence is good for NZD. High economic growth attracts foreign investment and may encourage the Reserve Bank of New Zealand to increase interest rates, if this economic strength comes together with elevated inflation. Conversely, if economic data is weak, NZD is likely to depreciate.
The New Zealand Dollar (NZD) tends to strengthen during risk-on periods, or when investors perceive that broader market risks are low and are optimistic about growth. This tends to lead to a more favorable outlook for commodities and so-called ‘commodity currencies’ such as the Kiwi. Conversely, NZD tends to weaken at times of market turbulence or economic uncertainty as investors tend to sell higher-risk assets and flee to the more-stable safe havens.
Author

Joshua Gibson
FXStreet
Joshua joins the FXStreet team as an Economics and Finance double major from Vancouver Island University with twelve years' experience as an independent trader focusing on technical analysis.


