AUD/JPY edges higher as RBA-BoJ policy divergence widens
- Hawkish RBA minutes and expectations of a BoJ April rate hike pull the cross in opposite directions
- RBA minutes reinforced the case for further tightening, while former Bank of Japan (BoJ) board member Adachi said a rate hike in April is likely as the central bank gathers sufficient data to justify a move.
- Thursday's Japanese January national Consumer Price Index (CPI) data (prior 2.1% year on year for core ex-fresh food) and Australian employment figures will be the dominant catalysts for the cross.

AUD/JPY firmed modestly on Wednesday, climbing around 0.4% as the Reserve Bank of Australia's (RBA) hawkish stance continues to underpin the Australian Dollar (AUD) side of the cross. The RBA's minutes released earlier this week flagged that inflation risks have increased and the Board is prepared to act again, contrasting with the Bank of Japan's (BoJ) more gradual normalization path from 0.75%. Japan's Q4 Gross Domestic Product (GDP) came in below expectations at 0.1% QoQ early this week, though this has not derailed market expectations for an April BoJ hike. Thursday brings a key double event risk: Australian January employment data early in the session, followed by Japanese National Consumer Price Index (CPI) inflation figures for January later in the trading day, where any upside surprise in core inflation could reinforce BoJ tightening bets and weigh on the cross.
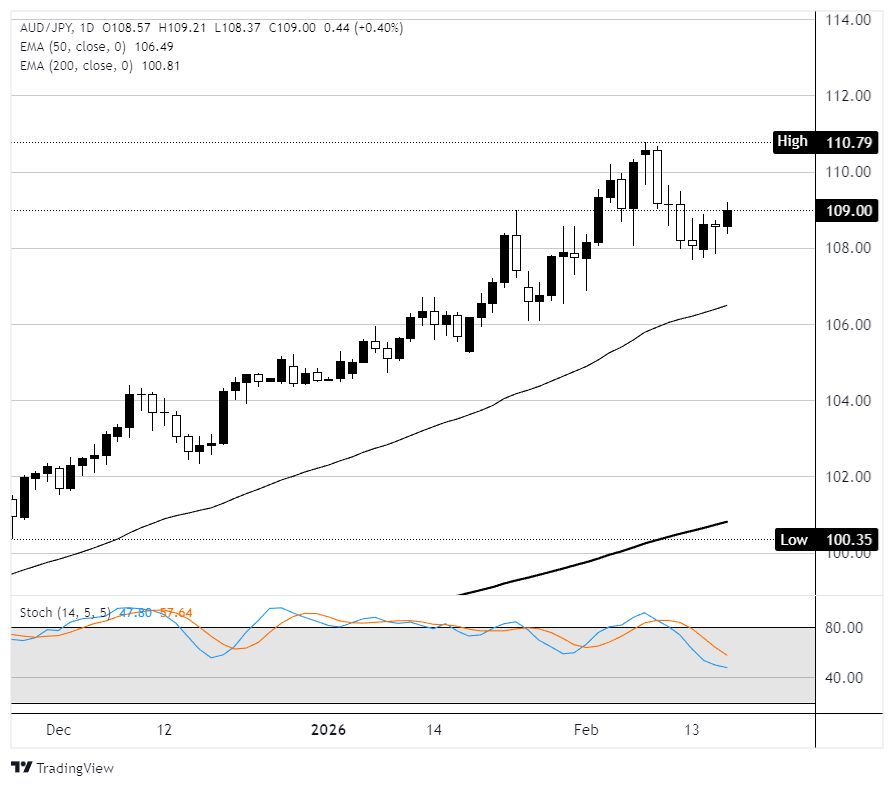
Consolidation near 109.00 as Stochastic drifts through the midrange
On the daily chart, AUD/JPY traded in a narrow range on Wednesday, closing near the 109.00 handle, up around 0.4% in an otherwise contained session. The pair continues to hold above the rising 50-day EMA near 106.50 and well above the 200-day EMA at 100.81, confirming that the uptrend from the late November low near 100.35 is continuing. The Stochastic Oscillator is parked in neutral territory near the midline, suggesting momentum is balanced and giving the pair room to develop in either direction depending on Thursday's data. A cluster of small-bodied candles near 109.00 over recent sessions points to a market waiting for a catalyst. Resistance sits at the year-to-date high of 110.790; a break above would open the path toward 112.00. Support rests at 108.00, with the 50-day EMA at 106.490 below.
AUD/JPY daily chart
Australian Dollar FAQs
One of the most significant factors for the Australian Dollar (AUD) is the level of interest rates set by the Reserve Bank of Australia (RBA). Because Australia is a resource-rich country another key driver is the price of its biggest export, Iron Ore. The health of the Chinese economy, its largest trading partner, is a factor, as well as inflation in Australia, its growth rate and Trade Balance. Market sentiment – whether investors are taking on more risky assets (risk-on) or seeking safe-havens (risk-off) – is also a factor, with risk-on positive for AUD.
The Reserve Bank of Australia (RBA) influences the Australian Dollar (AUD) by setting the level of interest rates that Australian banks can lend to each other. This influences the level of interest rates in the economy as a whole. The main goal of the RBA is to maintain a stable inflation rate of 2-3% by adjusting interest rates up or down. Relatively high interest rates compared to other major central banks support the AUD, and the opposite for relatively low. The RBA can also use quantitative easing and tightening to influence credit conditions, with the former AUD-negative and the latter AUD-positive.
China is Australia’s largest trading partner so the health of the Chinese economy is a major influence on the value of the Australian Dollar (AUD). When the Chinese economy is doing well it purchases more raw materials, goods and services from Australia, lifting demand for the AUD, and pushing up its value. The opposite is the case when the Chinese economy is not growing as fast as expected. Positive or negative surprises in Chinese growth data, therefore, often have a direct impact on the Australian Dollar and its pairs.
Iron Ore is Australia’s largest export, accounting for $118 billion a year according to data from 2021, with China as its primary destination. The price of Iron Ore, therefore, can be a driver of the Australian Dollar. Generally, if the price of Iron Ore rises, AUD also goes up, as aggregate demand for the currency increases. The opposite is the case if the price of Iron Ore falls. Higher Iron Ore prices also tend to result in a greater likelihood of a positive Trade Balance for Australia, which is also positive of the AUD.
The Trade Balance, which is the difference between what a country earns from its exports versus what it pays for its imports, is another factor that can influence the value of the Australian Dollar. If Australia produces highly sought after exports, then its currency will gain in value purely from the surplus demand created from foreign buyers seeking to purchase its exports versus what it spends to purchase imports. Therefore, a positive net Trade Balance strengthens the AUD, with the opposite effect if the Trade Balance is negative.
Author

Joshua Gibson
FXStreet
Joshua joins the FXStreet team as an Economics and Finance double major from Vancouver Island University with twelve years' experience as an independent trader focusing on technical analysis.