|

USD/CHF Price Analysis: Trapped between 0.9600, 200-bar SMA, looks for direction

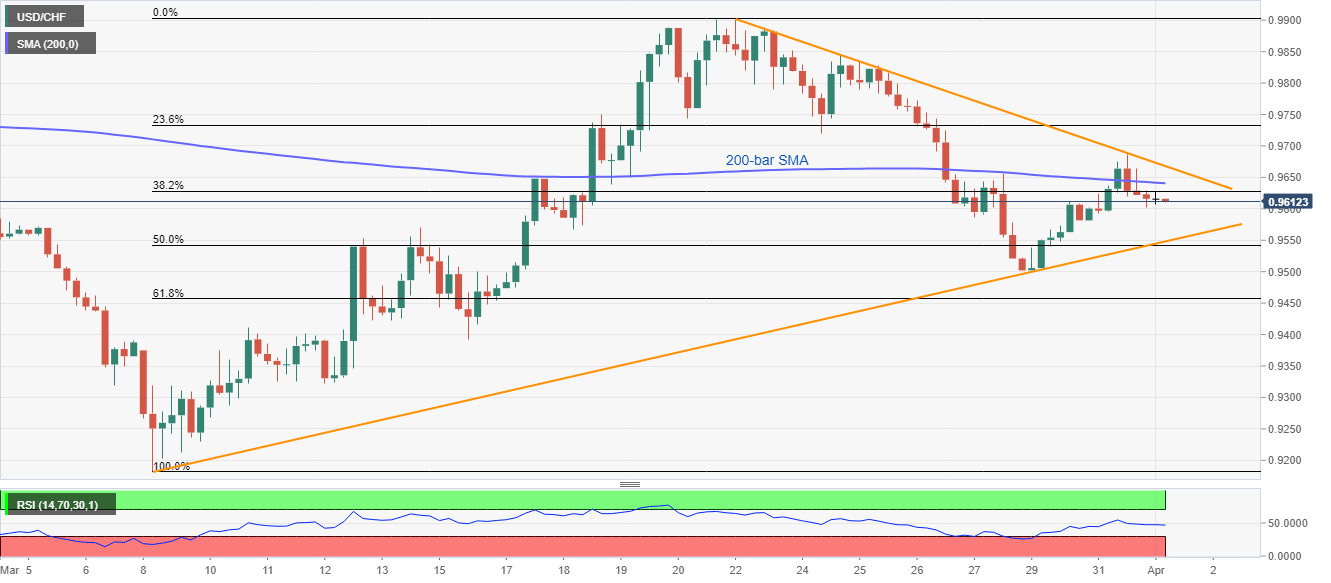
  • USD/CHF remains modestly changed after declining below 200-bar SMA.
  • A seven-day-old falling trend line acts as additional resistance.
  • Sellers will look for entry below the three-week-old rising trend line.

USD/CHF remains choppy between 0.9600 and 0.9630 ahead of the European session on Wednesday. In doing so, the quote remains below the short-term falling trend line and 200-bar SMA while also staying above an ascending support line since March 09.

It should also be noted that the pair’s neutral conditions could also be witnessed in the RSI moves that are in the normal territory inside the 30-70 range.

23.6% Fibonacci retracement of the previous month’s upside, around 0.9735 can please buyers if they manage to successfully cross, 200-bar SMA and aforementioned resistance line, respectively near 0.9640 and 0.9670.

On the downside, Friday’s low around 0.9500 can question the sellers past-0.9550 support line break ahead of pushing them to 61.8% Fibonacci retracement around 0.9455.

USD/CHF four-hour chart

Trend: SIdeways

Additional important levels

Overview
Today last price0.9611
Today Daily Change0.0000
Today Daily Change %0.00
Today daily open0.9611
 
Trends
Daily SMA200.9583
Daily SMA500.9674
Daily SMA1000.9744
Daily SMA2000.9811
 
Levels
Previous Daily High0.9686
Previous Daily Low0.9581
Previous Weekly High0.9902
Previous Weekly Low0.9502
Previous Monthly High0.9902
Previous Monthly Low0.9183
Daily Fibonacci 38.2%0.9646
Daily Fibonacci 61.8%0.9621
Daily Pivot Point S10.9566
Daily Pivot Point S20.9521
Daily Pivot Point S30.9461
Daily Pivot Point R10.9671
Daily Pivot Point R20.9731
Daily Pivot Point R30.9777

Author

Anil Panchal

Anil Panchal

FXStreet

Anil Panchal has nearly 15 years of experience in tracking financial markets. With a keen interest in macroeconomics, Anil aptly tracks global news/updates and stays well-informed about the global financial moves and their implications.

More from Anil Panchal
Share:

Editor's Picks

EUR/USD looks apathetic around 1.1770

EUR/USD comes under renewed pressure on Tuesday, deflating below the 1.1800 support and reversing two consecutive days of gains. The pair’s decline follows the persistent move higher in the US Dollar, as trade uncertainty dominates the sentiment ahead of President Trump’s SOTU speech.

GBP/USD regains 1.3500 and above

GBP/USD extends its advance for the third day in a row on Tuesday, this time retesting the area beyond the 1.3500 hurdle. Cable’s uptick comes despite decent gains in the Greenback and the dovish message from the BoE’s Bailey at the UK Parliament.

Gold appears offered around $5,150

Gold is giving back a good portion of the recent multi-day rally, receding to the $5,150 zone per troy ounce amid the decent bounce in the US Dollar and mixed US Treasuty yields. In the meantime, markets’ attention remain on upcoming comments from Fed speakers.

Ripple’s DeFi shift in focus: Navigating XRPL EVM sidechain growth, XRPFi migration and liquidity

Ripple (XRP) has continued to trade under pressure, extending its decline by approximately 63% from the record high of $3.66 in July. The remittance token is trading above support at $1.35, while its upside appears limited by key supply zones, starting with $1.40, at the time of writing on Tuesday.

The Citrini report: How a debatable AI narrative can shake Wall Street

That AI-related headline alone was enough to rattle investors.US stocks slid sharply on Monday after a widely circulated Citrini Research memo outlined a hypothetical “2028 Global Intelligence Crisis”, warning that rapid AI adoption could push US unemployment into double digits as early as by mid-2028.

XRP pressured by weak ETF flows and declining retail interest

Ripple (XRP) is edging lower, trading above its intraday low of $1.32 at the time of writing on Tuesday. The decline from its weekly opening of $1.39 reflects heightened volatility in the broader cryptocurrency market, accentuated by tariff-triggered uncertainty.