|

USD/CHF Price Analysis: Hovers below 23.6% Fibonacci retracement, trades near 0.8870

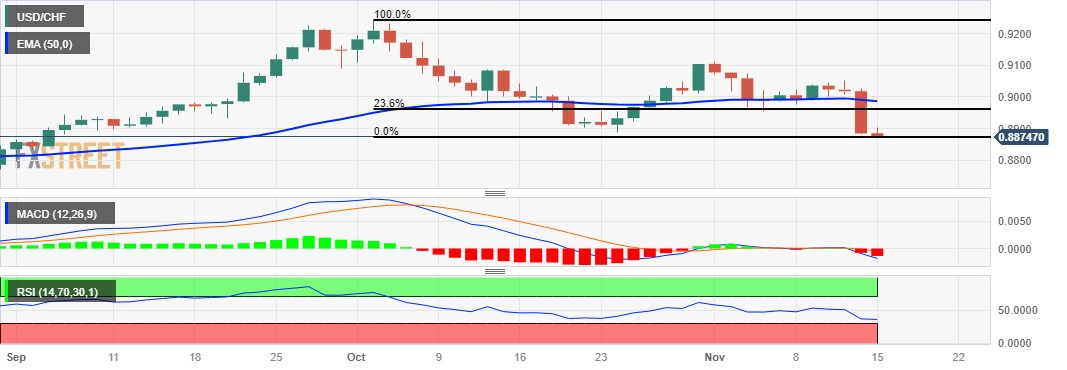
  • USD/CHF has lost more than 100 pips in the previous session.
  • MACD indicates a slower pace of the prevailing bearish trend.
  • The major level at 0.8900 appears as the immediate resistance lined up with the 23.6% Fibonacci retracement.

USD/CHF lost more than 100 pips in the previous session, due to the downbeat US inflation data. The USD/CHF pair extends the losses, trading near 0.8870 during the European session on Wednesday.

A decisive break below the latter could push the USD/CHF pair to reach the support region near 0.8800 psychological level lined up with September’s low at 0.8795.

The technical indicators for the USD/CHF pair reveal a bearish outlook. The 14-day Relative Strength Index (RSI) below the 50 level indicates downward pressure, signaling a bearish momentum and reflecting a weaker market sentiment.

On the upside, the psychological level at 0.8900 appears as the immediate resistance, followed by the 23.6% Fibonacci retracement at 0.8922. A firm break above the level could inspire the USD/CHF pair to explore the next resistance around the 50-day Exponential Moving Average (EMA) at 0.8986.

Moreover, the Moving Average Convergence Divergence (MACD) line, although below the centerline, is positioned above the signal line. This suggests a somewhat tepid momentum in the USD/CHF pair, indicating a less pronounced bearish sentiment.

USD/CHF: Daily Chart
USD/CHF: other technical levels to watch

Overview
Today last price0.8871
Today Daily Change-0.0013
Today Daily Change %-0.15
Today daily open0.8884
 
Trends
Daily SMA200.8993
Daily SMA500.9024
Daily SMA1000.8902
Daily SMA2000.8997
 
Levels
Previous Daily High0.9028
Previous Daily Low0.888
Previous Weekly High0.9046
Previous Weekly Low0.8954
Previous Monthly High0.9244
Previous Monthly Low0.8888
Daily Fibonacci 38.2%0.8937
Daily Fibonacci 61.8%0.8972
Daily Pivot Point S10.8833
Daily Pivot Point S20.8782
Daily Pivot Point S30.8685
Daily Pivot Point R10.8982
Daily Pivot Point R20.9079
Daily Pivot Point R30.913

Author

Akhtar Faruqui

Akhtar Faruqui is a Forex Analyst based in New Delhi, India. With a keen eye for market trends and a passion for dissecting complex financial dynamics, he is dedicated to delivering accurate and insightful Forex news and analysis.


More from Akhtar Faruqui
Share:

Editor's Picks

GBP/USD revisits 1.3530; Dollar pushes harder

GBP/USD adds to the weekly correction and recedes toward the 1.3530 zone on Friday. Indeed, Cable faces increasing selling pressure on the back of extra gains in the Greenback, particularly fuelled by Chair Warsh’s speech at the Jackson Hole Symposium and the US NFP Annual Revision (-79K).

EUR/USD breaches below 1.1600, multi-day lows

EUR/USD now accelerates its decline and retreats to seven-day troughs in the sub-1.1600 region at the end of the week. The pair’s pullback comes on the back of the strong rebound in the US Dollar after Chair Warsh delivered a hawkish message in Jackson Hole, while the US NFP Annual Revision came in at -79K.

Gold challenges its 200-day SMA near $4,530

Gold’s decline gathers fresh steam, hitting weekly lows while disputing its critical 200-day SMA near $4,530 per troy ounce. The yellow metal’s increasing weakness comes in response to the generalised upbeat tone in the US Dollar and the widespread rebound in US Treasury yields, as investors continue to reprice a Fed rate hike in September.

Week ahead: RBNZ and BoC decide on rates ahead of all-important US NFP
The US dollar staged a modest recovery this week, perhaps as traders decided to cover some of their short positions amid slightly stickier or in-line US PCE inflation numbers for July, confounding expectations of softer prints amid the softness revealed in the CPI data for the month.
CFTC Report: CAD short covering leads; Gold buying surges
The week in one sentence: speculative positioning shifted more constructively in the week to August 25. CAD short covering led the move, followed by a broad reduction in EUR shorts and renewed Gold buying. GBP and VIX positioning also improved, while JPY positioning deteriorated and WTI flows diverged from weaker prices.
Diesel’s record $100 warning: The oil shock hiding in plain sight

The Oil market may look calmer than it did a few months ago, but diesel is sending a very different message. The US diesel crack spread, the premium of ultra-low sulphur diesel futures over WTI, recently surged above $100 per barrel for the first time, reaching an intraday record of just over $102.00.