USD/CHF Price Analysis: Bulls take a breather, still above 21-HMA ahead of SNB


  • USD/CHF bounced off key support on the hourly chart after the slump.
  • Hourly RSI rebounds from the oversold region, points north.
  • 21-HMA to challenge XAG/USD’s pullback from monthly lows.

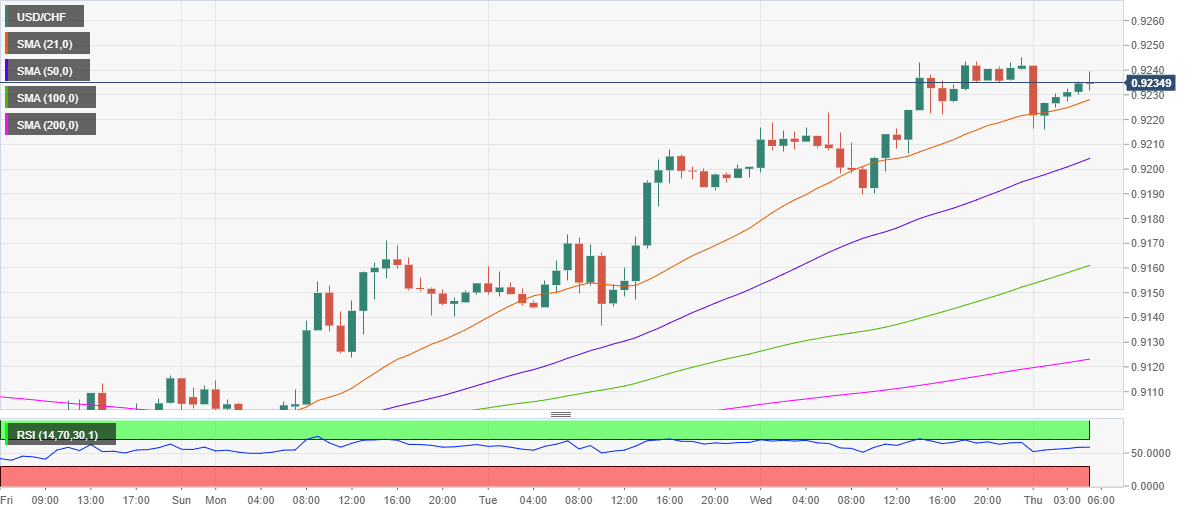
USD/CHF is consolidating its four-day winning streak to two-month highs of 0.9245 amid the ongoing US dollar’s upbeat momentum, as the focus now shifts towards the Swiss National Bank’s (SNB) quarterly monetary policy assessment, due later on Thursday at 0730 GMT.  

The SNB is expected to leave the benchmark sight deposit rate unchanged at -0.75% while maintaining the 3-Month Libor Target Range steady between -1.25% to -0.25%. The central bank is likely to reiterate that it will remain active in the fx markets, despite the recent weakness in the Swiss franc.

Short-term technical outlook

As observed on the hourly chart, the spot edges north, having managed to hold above the critical 21-daily Simple Moving Average (DMA), currently at 0.9228.

The price has formed a Doji candlestick, at the time of writing, suggesting that the buyers are turning cautious ahead of the SNB rate decision.

However, the path of least resistance remains to the upside, with the hourly Relative Strength Index (RSI) inching higher above the midline at 58.80. Also, backing the bullish case, the price trades above all major HMAs.

The major could test the July 24 high of 0.9260 should the bulls regain control. The next barrier is seen at 0.9300.

Alternatively, the 21-HMA support could limit the downside, below which the bears could challenge the intraday lows of 0.9215.

Further south, the upward-sloping 50-HMA at 0.9206 could be put to test should the selling pressure intensify.

USD/CHF: Hourly chart

fxsoriginal

USD/CHF: Additional levels

USD/CHF

Overview
Today last price 0.9236
Today Daily Change -0.0003
Today Daily Change % -0.03
Today daily open 0.924
 
Trends
Daily SMA20 0.9115
Daily SMA50 0.9146
Daily SMA100 0.9352
Daily SMA200 0.9522
 
Levels
Previous Daily High 0.9244
Previous Daily Low 0.919
Previous Weekly High 0.914
Previous Weekly Low 0.9052
Previous Monthly High 0.9242
Previous Monthly Low 0.8999
Daily Fibonacci 38.2% 0.9223
Daily Fibonacci 61.8% 0.921
Daily Pivot Point S1 0.9206
Daily Pivot Point S2 0.9171
Daily Pivot Point S3 0.9152
Daily Pivot Point R1 0.9259
Daily Pivot Point R2 0.9278
Daily Pivot Point R3 0.9313


Share: Feed news

Information on these pages contains forward-looking statements that involve risks and uncertainties. Markets and instruments profiled on this page are for informational purposes only and should not in any way come across as a recommendation to buy or sell in these assets. You should do your own thorough research before making any investment decisions. FXStreet does not in any way guarantee that this information is free from mistakes, errors, or material misstatements. It also does not guarantee that this information is of a timely nature. Investing in Open Markets involves a great deal of risk, including the loss of all or a portion of your investment, as well as emotional distress. All risks, losses and costs associated with investing, including total loss of principal, are your responsibility. The views and opinions expressed in this article are those of the authors and do not necessarily reflect the official policy or position of FXStreet nor its advertisers. The author will not be held responsible for information that is found at the end of links posted on this page.

If not otherwise explicitly mentioned in the body of the article, at the time of writing, the author has no position in any stock mentioned in this article and no business relationship with any company mentioned. The author has not received compensation for writing this article, other than from FXStreet.

FXStreet and the author do not provide personalized recommendations. The author makes no representations as to the accuracy, completeness, or suitability of this information. FXStreet and the author will not be liable for any errors, omissions or any losses, injuries or damages arising from this information and its display or use. Errors and omissions excepted.

The author and FXStreet are not registered investment advisors and nothing in this article is intended to be investment advice.

Recommended content


Recommended content

Editors’ Picks

EUR/USD holds below 1.0750 ahead of key US data

EUR/USD holds below 1.0750 ahead of key US data

EUR/USD trades in a tight range below 1.0750 in the European session on Friday. The US Dollar struggles to gather strength ahead of key PCE Price Index data, the Fed's preferred gauge of inflation, and helps the pair hold its ground. 

EUR/USD News

USD/JPY stays firm above 156.00 after BoJ Governor Ueda's comments

USD/JPY stays firm above 156.00 after BoJ Governor Ueda's comments

USD/JPY stays firm above 156.00 after surging above this level on the Bank of Japan's decision to leave the policy settings unchanged. BoJ Governor said weak Yen was not impacting prices but added that they will watch FX developments closely.

USD/JPY News

Gold price oscillates in a range as the focus remains glued to the US PCE Price Index

Gold price oscillates in a range as the focus remains glued to the US PCE Price Index

Gold price struggles to attract any meaningful buyers amid the emergence of fresh USD buying. Bets that the Fed will keep rates higher for longer amid sticky inflation help revive the USD demand.

Gold News

Bitcoin Weekly Forecast: BTC’s next breakout could propel it to $80,000 Premium

Bitcoin Weekly Forecast: BTC’s next breakout could propel it to $80,000

Bitcoin’s recent price consolidation could be nearing its end as technical indicators and on-chain metrics suggest a potential upward breakout. However, this move would not be straightforward and could punish impatient investors. 

Read more

US core PCE inflation set to signal firm price pressures as markets delay Federal Reserve rate cut bets

US core PCE inflation set to signal firm price pressures as markets delay Federal Reserve rate cut bets

The core PCE Price Index, which excludes volatile food and energy prices, is seen as the more influential measure of inflation in terms of Fed positioning. The index is forecast to rise 0.3% on a monthly basis in March, matching February’s increase. 

Read more

Forex MAJORS

Cryptocurrencies

Signatures