|

USD/CHF Price Analysis: Bounces off 1.5-month low, not out of the woods

  • USD/CHF wavers around intraday high following its U-turn from September 01 low.
  • Multiple joints of the key EMAs and technical levels marked during the month probe the recovery moves.
  • Fresh selling can aim for 0.9000 psychological magnet.

USD/CHF takes round to the day’s top of 0.9070, currently around 0.9068, while heading into the European session on Thursday. In doing so, the pair nurses the previous day’s losses that dragged it to the multi-day low.

While bullish MACD suggests the pair’s further pullback, strong upside barriers are likely to probe the USD/CHF buyers going forward.

Among them, the first will be a confluence of 100-hour EMA and October 12 low near 0.9086/87, a break of which will direct the pair towards a joint of Tuesday’s high and 200-hour EMA surrounding 0.9105/10.

It should be noted that the 61.8% Fibonacci retracement of October 08 to 21 downside, close to 0.9135, offers an additional upside hurdle to the USD/CHF prices before empowering an upside towards the weekly high of 0.9165.

Alternatively, 0.9050 and 0.9030 can offer immediate supports during the quote’s fresh downside ahead of the August month’s low, also the lowest since early 2015, near 0.8998.

USD/CHF hourly chart
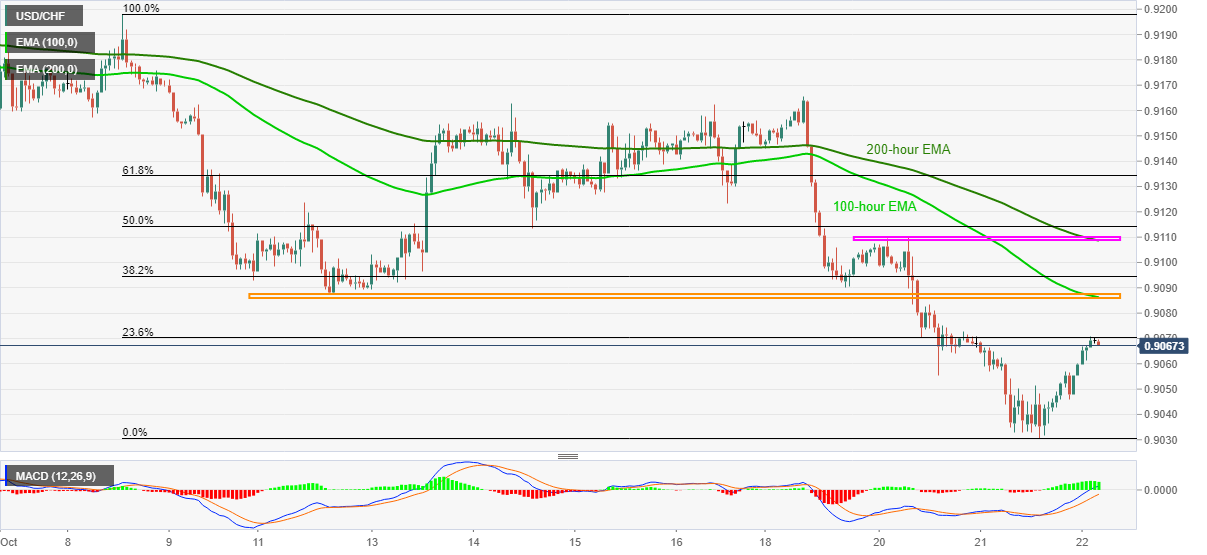
Trend: Bearish

Additional important levels

Overview
Today last price0.9069
Today Daily Change13 pips
Today Daily Change %0.14%
Today daily open0.9056
 
Trends
Daily SMA200.9163
Daily SMA500.913
Daily SMA1000.9248
Daily SMA2000.9465
 
Levels
Previous Daily High0.9072
Previous Daily Low0.9031
Previous Weekly High0.9163
Previous Weekly Low0.9088
Previous Monthly High0.9296
Previous Monthly Low0.8999
Daily Fibonacci 38.2%0.9046
Daily Fibonacci 61.8%0.9056
Daily Pivot Point S10.9034
Daily Pivot Point S20.9012
Daily Pivot Point S30.8993
Daily Pivot Point R10.9074
Daily Pivot Point R20.9093
Daily Pivot Point R30.9115

Author

Anil Panchal

Anil Panchal

FXStreet

Anil Panchal has nearly 15 years of experience in tracking financial markets. With a keen interest in macroeconomics, Anil aptly tracks global news/updates and stays well-informed about the global financial moves and their implications.

More from Anil Panchal
Share:

Editor's Picks

EUR/USD falls to near 1.1600 due to persistent bearish bias

EUR/USD depreciates after registering modest gains in the previous session, trading around 1.1610 during the Asian hours on Thursday. The technical analysis of the daily chart suggests a persistent bearish bias as the EUR/USD pair remains within the descending channel pattern.

GBP/USD underperforms as UK faces stagflation risks amid Middle East war

The Pound Sterling trades lower against its major currency peers, is down 0.22% around 1.3340 against the US Dollar, during the Asian trade on Thursday. The British currency faces selling pressures amid fears that the United Kingdom economy could face stagflation risks due to higher energy prices, a situation in which inflation accelerates with economic growth and employment conditions remaining stagnant.

Gold climbs near $5,200 as Iran war fuels safe-haven demand

Gold price extends its gains for the second successive session on Thursday as traders seek safety amid the ongoing war in the Middle East. US and Israeli strikes across Iranian territory and widespread Iranian missile and drone retaliation across the Middle East, including attacks on regional targets and military sites, prolong the crisis and its impact.

Top Crypto Gainers: Decred, Zcash, and Dogecoin lead recovery as Bitcoin crosses $72,000

Bitcoin trades above $72,500 at press time on Thursday, holding its 6% gain from the previous day, contributing to a broader market recovery. The total cryptocurrency market capitalization stands at over $2.43 trillion as the broader market sentiment improves significantly.

First Venezuela, now Iran: The US-China energy war escalates

At first glance, the latest escalation involving the United States with both Iran and Venezuela looks like another chapter in a long-running geopolitical story. But viewed through a broader strategic lens, something else may be unfolding: Energy.

Cardano Price Analysis: Approaches key trendline amid bearish sentiment

Cardano (ADA) price is approaching its descending trendline around $0.28 at the time of writing, set to shape the next directional move. The derivatives metrics paint a bearish picture, with ADA’s Open Interest continuing to fall and short bets rising among traders.