USD/CHF clears daily losses after SNB decision and US data
- USD/CHF found support at a low of 0.8905 and then jumped to 0.8965.
- SNB hiked interest rates by 25 bps as expected.
- USD gained traction on the back of rising US bond yields during Chair Powell’s testimony.

On Thursday, the USD/CHF showed volatility – falling to a daily low of 0.8905 and then recovering to 0.8965. Initially, the CHF gained some traction after the Swiss National Bank (SNB) hiked rates by 25 basis points, but the rise in US bond yields, following US data and Federal Reserve (Fed) Chairman Jerome Powell’s testimony, limited the Swiss currency’s upside potential.
Investors asses SNB and US data
The Swiss National Bank raised its key rates by 25 basis points (bps), as the markets expected, to 1.75%. In addition, in the statement, the bank noted that It cannot be ruled out that additional rises in the SNB policy rate will be necessary to ensure price stability over the medium term. Moreover, they stated that they expect GDP to remain robust and that the unemployment rate will increase slightly. The announcement strengthened the Swiss Franc, pushing USD/CHF south, as higher interest rates tend to attract inflows of foreign capital.
The US Bureau Census of Analysis released the Jobless Claims for the week ending on June 16, which came in at 264K vs the 262k expected and from the previous 260k reading. In addition, the Chicago Fed National Activity index came in at 0.15 contraction vs the consensus 0. Moreover, Existing Home Sales data showed strength in the housing sector as they came in at 4.3M vs the 4.25M expected by the consensus.
Furthermore, during his second testimony before the US Congress, Jerome Powell, chair of the Federal Reserve (Fed) noted that the Federal Open Market Committee (FOMC) broadly feels it will be suitable to raise rates again this year and perhaps two more times. As a reaction, shorter-term US bond yields rose, with the 2-year rate jumping to its highest level since Friday to 4.78%, seeing a 1% increase. This supported the US Dollar and led USD/CHF to recover.
USD/CHF Levels to watch
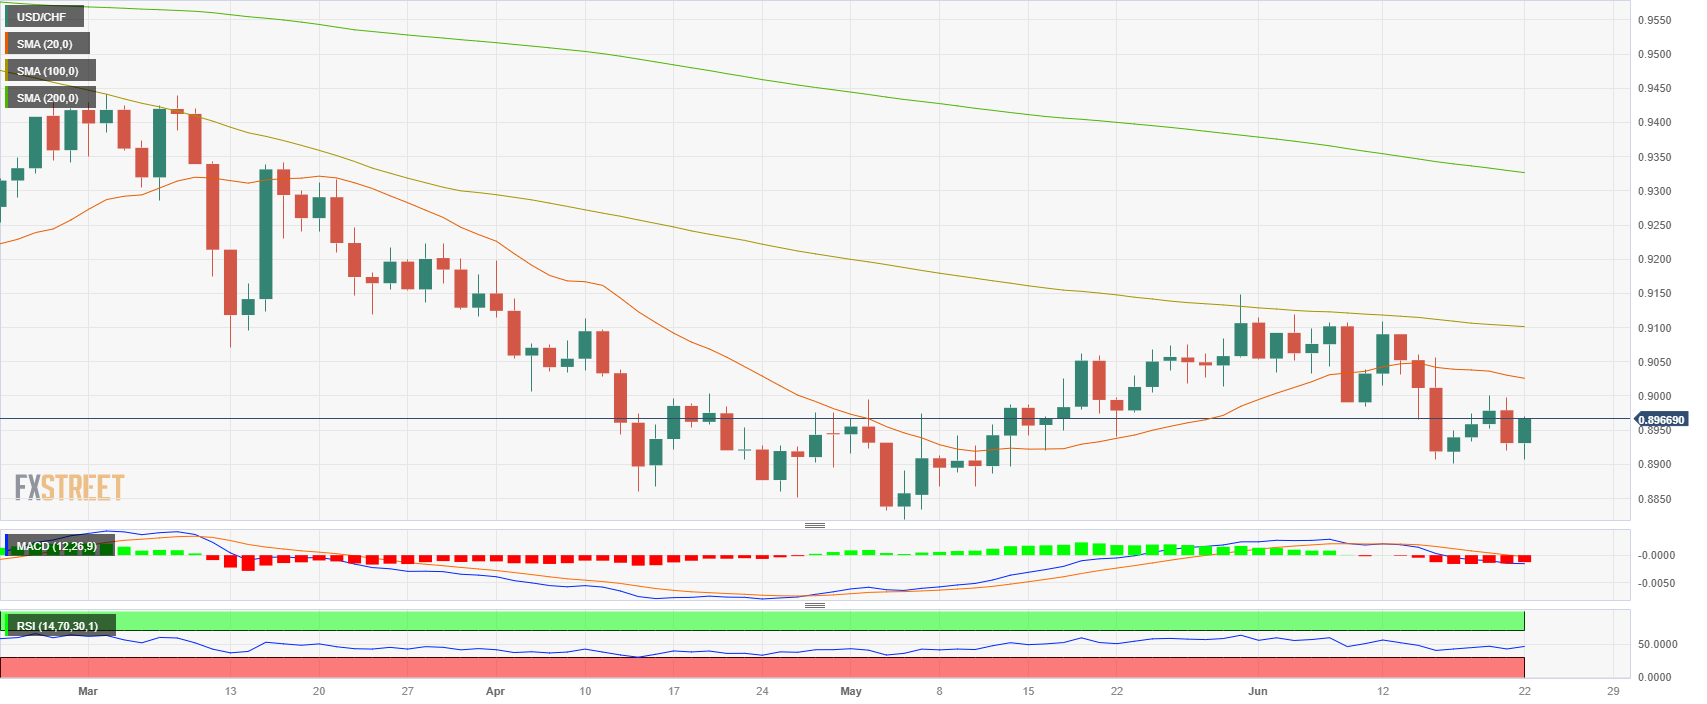
According to the daily chart, despite indicators gaining some traction, the general outlook is still negative. The Relative Strength Index (RSI) and Moving Average Convergence Divergence (MACD) stand in negative territory, indicating that the bears have the upperhand.
Resistance levels to watch: 0.9000, 0.9010 and the 20-day Simple Moving Average (SMA), 0.9025.
Support Levels to watch: 0.8930, 0.8905 (daily low), 0.8900 (psychological mark).
USD/CHF Daily chart
Author

Patricio Martín
FXStreet
Patricio is an economist from Argentina passionate about global finance and understanding the daily movements of the markets.


