USD/CAD Price Forecast: Extends winning streak for fifth trading day
- USD/CAD jumps to near 1.3770 as the US Dollar gains on upbeat market mood.
- Market sentiment turns risk-averse as the US strikes Venezuela.
- Investors await the US ISM Manufacturing PMI data for December.

The USD/CAD pair extends its winning streak for the fifth trading day on Monday. The Loonie pair trades 0.25% higher to near 1.3770 during the European trading session as the US Dollar (USD) gains, while the Canadian Dollar (CAD) underperforms in a dismal market mood.
At the time of writing, the US Dollar Index (DXY), which tracks the Greenback’s value against six major currencies, trades 0.2% higher to near 98.60.
Investors turn risk-averse amid geopolitical risks, following the United States’ (US) strike on Venezuela.
On the domestic front, the US Dollar is expected to trade volatile as a slew of US economic data, notably the Nonfarm Payrolls (NFP) data, is lined up for release this week.
In Monday’s session, investors will focus on the US ISM Manufacturing PMI data for December, which will be published at 15:00 GMT. The Manufacturing PMI is expected to come in slightly higher at 48.3 from 48.2 in November.
USD/CAD technical analysis
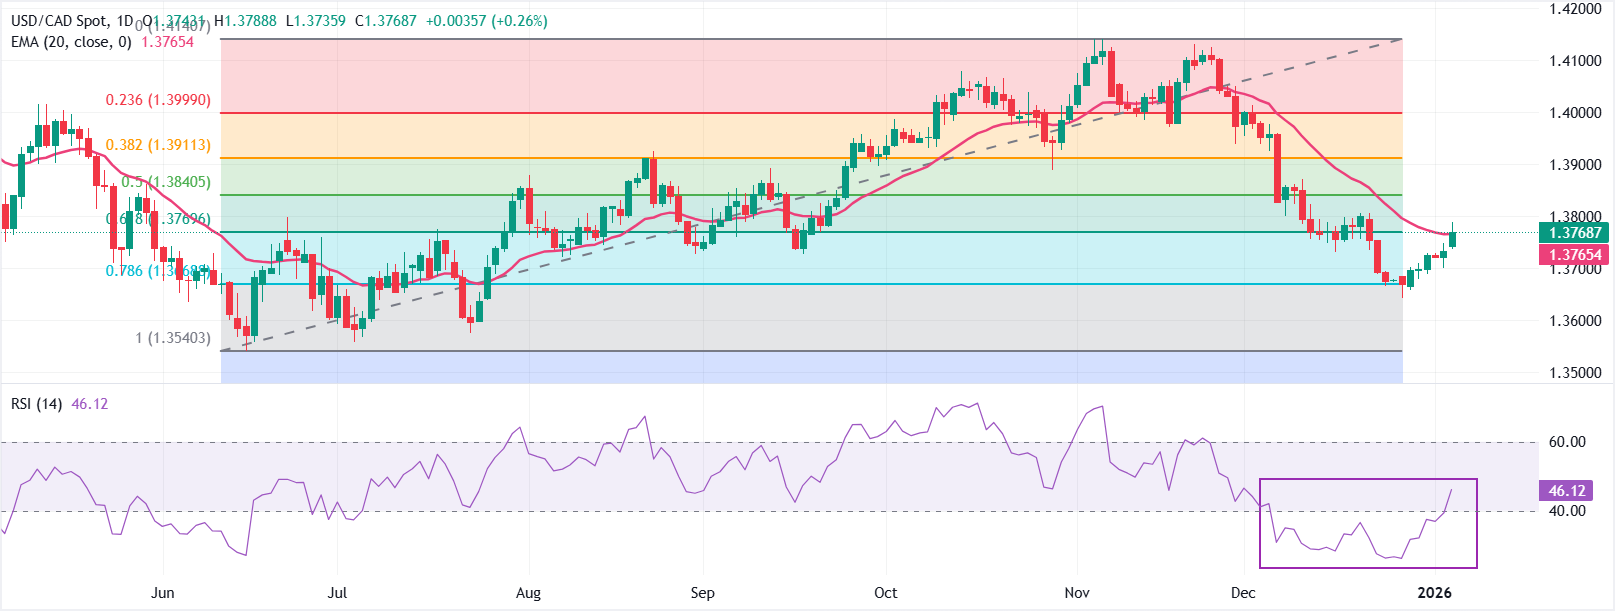
In the daily chart, USD/CAD trades at 1.3768. The 20-day EMA has flattened at 1.3765 after a steady descent, with price marginally back above it. A daily close above the average would hint at a near-term base, while a slip back below would preserve the bearish bias. RSI at 46 recovers from oversold yet remains under the 50 midline. Measured from the 1.3540 low to the 1.4141 high, the 61.8% retracement at 1.3770 offers initial support.
Should buyers sustain a foothold above the 20-day EMA, a rebound toward the 50% retracement at 1.3840 could unfold. Failure to defend nearby retracement support would keep the tone fragile and leave downside risks intact. A move above RSI 50 would reinforce recovery attempts, while rejection beneath would cap rebounds.
(The technical analysis of this story was written with the help of an AI tool.)
Economic Indicator
ISM Manufacturing PMI
The Institute for Supply Management (ISM) Manufacturing Purchasing Managers Index (PMI), released on a monthly basis, is a leading indicator gauging business activity in the US manufacturing sector. The indicator is obtained from a survey of manufacturing supply executives based on information they have collected within their respective organizations. Survey responses reflect the change, if any, in the current month compared to the previous month. A reading above 50 indicates that the manufacturing economy is generally expanding, a bullish sign for the US Dollar (USD). A reading below 50 signals that factory activity is generally declining, which is seen as bearish for USD.
Read more.Next release: Mon Jan 05, 2026 15:00
Frequency: Monthly
Consensus: 48.3
Previous: 48.2
Source: Institute for Supply Management
The Institute for Supply Management’s (ISM) Manufacturing Purchasing Managers Index (PMI) provides a reliable outlook on the state of the US manufacturing sector. A reading above 50 suggests that the business activity expanded during the survey period and vice versa. PMIs are considered to be leading indicators and could signal a shift in the economic cycle. Stronger-than-expected prints usually have a positive impact on the USD. In addition to the headline PMI, the Employment Index and the Prices Paid Index numbers are watched closely as they shine a light on the labour market and inflation.
Author

Sagar Dua
FXStreet
Sagar Dua is associated with the financial markets from his college days. Along with pursuing post-graduation in Commerce in 2014, he started his markets training with chart analysis.


