USD/CAD Price Analysis: Sellers attack weekly support around 1.2950
- USD/CAD retreats from monthly top, flirts with short-term support line of late.
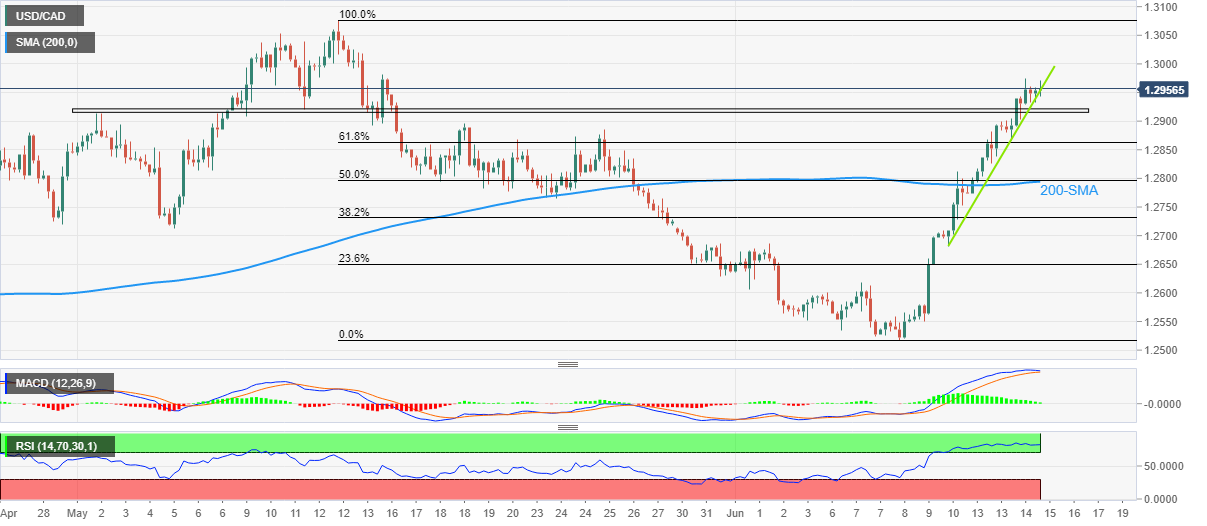
- Overbought RSI, impending bear cross on MACD teases sellers.
- Weekly ascending trend line, horizontal support from early May restricts immediate moves.
- Buyers have a bumpy road to the yearly top marked in May.

USD/CAD fades upside momentum at the monthly high, retreating to 1.2950 during early Wednesday morning in Europe.
The Loonie pair’s pullback could be linked to the overbought RSI conditions, as well as a looming bear cross of the MACD. That said, the pullback remains elusive until the quote breaks the weekly support line, around 1.2950 by the press time.
Even so, a horizontal area comprising multiple levels marked since May 02, around 1.2920-15, will challenge the USD/CAD sellers.
Additionally, the 61.8% Fibonacci retracement (Fibo.) of May 12 to June 08 downside, near 1.2860, will precede the 1.2795 support confluence, including the 200-SMA and 50% Fibo, to limit the further downside of the pair.
Alternatively, recovery moves could initially be challenged by mid-May swing high, close to 1.2980, before highlighting the 1.3000 threshold as the key hurdle.
In a case where the USD/CAD prices rally beyond 1.3000, multiple resistances surrounding 1.3040-50, followed by May’s peak of 1.3076, might question the upside momentum.
Overall, USD/CAD is likely to witness a pullback but the downside appears limited.
USD/CAD: Four-hour chart
Trend: Pullback expected
Author

Anil Panchal
FXStreet
Anil Panchal has nearly 15 years of experience in tracking financial markets. With a keen interest in macroeconomics, Anil aptly tracks global news/updates and stays well-informed about the global financial moves and their implications.


