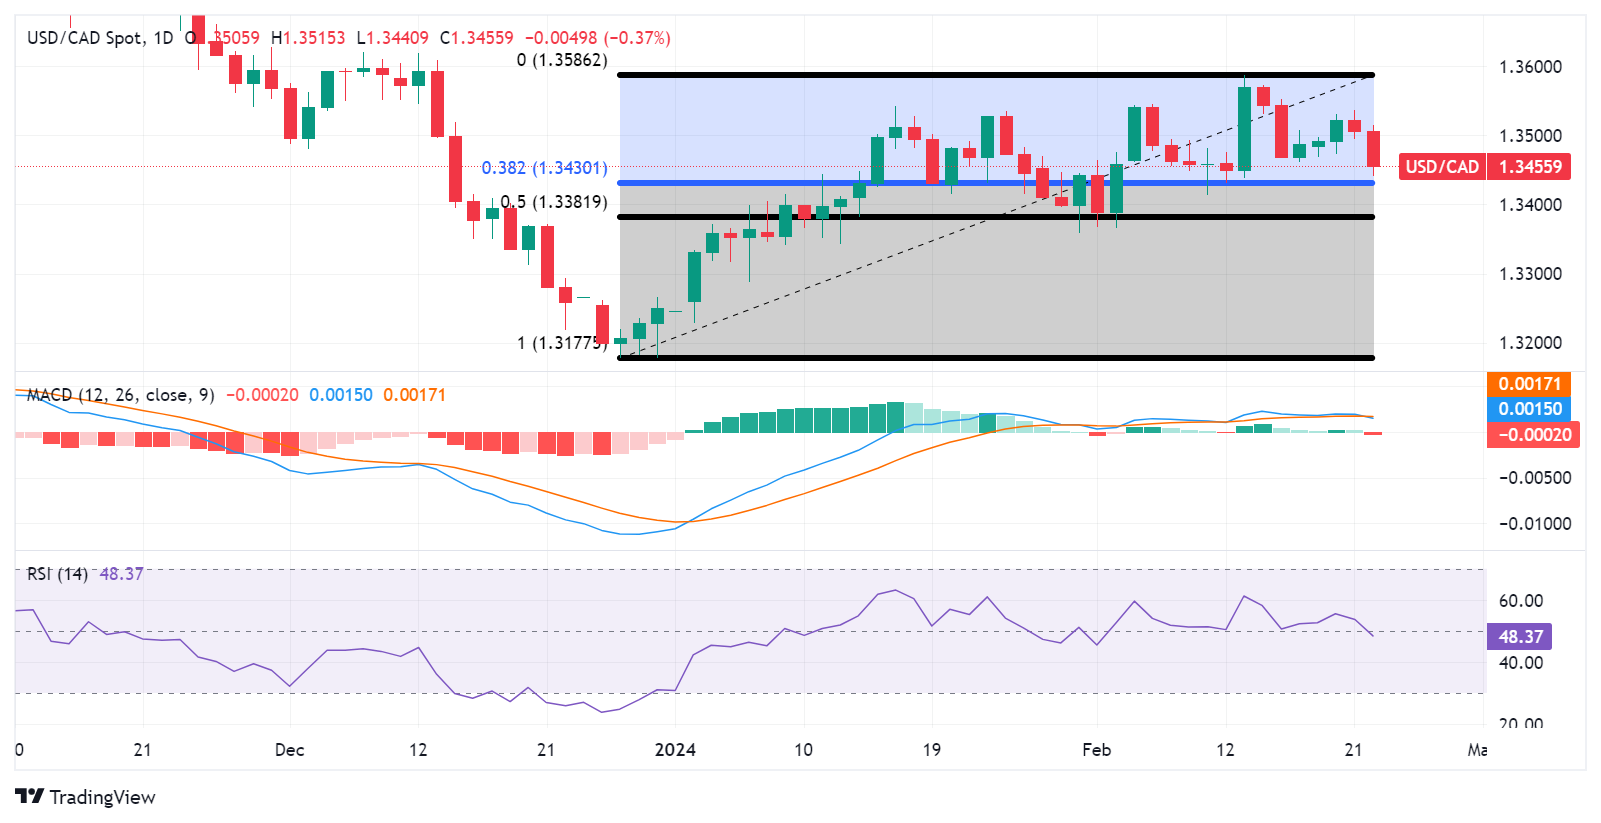
- USD/CAD could breach the major support at the 1.3450 level.
- Technical indicators suggest a potential momentum shift towards a downward trend.
- A break above 1.3500 could lead the pair to test the weekly high at 1.3536 and the major barrier at 1.3550.
USD/CAD moves in a downward direction for the second consecutive day, trading around 1.3460 during the European session on Thursday. The pair is positioned just above the major support level of 1.3450. The technical analysis of the 14-day Relative Strength Index (RSI) is positioned below 50, suggesting bearish momentum for the USD/CAD pair.
A break below the major support could put downward pressure on the USD/CAD pair to test the support level of the 38.2% Fibonacci retracement level at 1.3430. If the pair breaches the latter, it could navigate the psychological support region at 1.3400 level followed by the 50.0% retracement level of 1.3381.
Additionally, the lagging indicator Moving Average Convergence Divergence (MACD) for the USD/CAD pair suggests a possible shift in momentum towards a downward trend in the market. This assessment is derived from the positioning of the MACD line above the centerline but below the signal line. Traders may opt to await clearer directional sentiment from the MACD indicator before making trading decisions.
On the upside, the USD/CAD pair may encounter significant resistance at the psychological level of 1.3500. A decisive breakthrough above this psychological resistance could generate positive sentiment, potentially propelling the pair to test the resistance zone around the weekly high at 1.3536 and the major barrier at 1.3550. Further upside momentum could see the pair approaching the February high at 1.3586.
USD/CAD: Daily Chart
Information on these pages contains forward-looking statements that involve risks and uncertainties. Markets and instruments profiled on this page are for informational purposes only and should not in any way come across as a recommendation to buy or sell in these assets. You should do your own thorough research before making any investment decisions. FXStreet does not in any way guarantee that this information is free from mistakes, errors, or material misstatements. It also does not guarantee that this information is of a timely nature. Investing in Open Markets involves a great deal of risk, including the loss of all or a portion of your investment, as well as emotional distress. All risks, losses and costs associated with investing, including total loss of principal, are your responsibility. The views and opinions expressed in this article are those of the authors and do not necessarily reflect the official policy or position of FXStreet nor its advertisers. The author will not be held responsible for information that is found at the end of links posted on this page.
If not otherwise explicitly mentioned in the body of the article, at the time of writing, the author has no position in any stock mentioned in this article and no business relationship with any company mentioned. The author has not received compensation for writing this article, other than from FXStreet.
FXStreet and the author do not provide personalized recommendations. The author makes no representations as to the accuracy, completeness, or suitability of this information. FXStreet and the author will not be liable for any errors, omissions or any losses, injuries or damages arising from this information and its display or use. Errors and omissions excepted.
The author and FXStreet are not registered investment advisors and nothing in this article is intended to be investment advice.
Recommended content
Editors’ Picks
AUD/USD faces decent resistance near 0.6650

AUD/USD added to the positive tone seen on Monday and rose further north of 0.6600 the figure on the back of the weaker Dollar and positive developments in the commodity complex.
EUR/USD targets the 1.0880 zone ahead of US, EMU data

EUR/USD kept the bullish bias well in place for the second session in a row, leaving behind the 1.0800 barrier and the key 200-day SMA (1.0790) prior to key data releases in the EMU and US on Wednesday.
Gold regains its poise on broad US Dollar’s weakness

Following Monday's decline, Gold stages a rebound toward $2,350 on Tuesday. The benchmark 10-year US Treasury bond yield stays in negative territory below 4.5% after April producer inflation data, allowing XAU/USD to hold its ground.
Bitcoin price defends $61K with GameStop stock resurgence likely to generate renewed appetite for risk assets

Bitcoin (BTC) price tests the patience of traders as it glides along an ascending trendline on the four-hour time frame. Meanwhile, the GameStop saga that has resurfaced after three years distracts the market.
Is the US Dollar headed for a crash?

Ahead of the US CPI & Retail Sales report, I breakdown how to combine forex fundamentals with technicals to determine whether we've seen a US dollar top?