|

USD/CAD Price Analysis: Drops back closer to 100-period SMA/ascending trend-line confluence

  • USD/CAD meets with a fresh supply on Friday and is pressured by a combination of factors.
  • A break below the 1.3600-1.3590 confluence support will pave the way for deeper losses.
  • Investors now look to the monthly Canadian GDP and the US PCE data for a fresh impetus.

The USD/CAD pair comes under some renewed selling pressure on the last day of the week and continues losing ground through the first half of the European session. The pair drops to the 1.3600 mark, or a fresh daily low in the last hour, and is pressured by a combination of factors.

A modest recovery in the equity markets is seen weighing on the safe-haven US Dollar. Apart from this, bullish crude oil prices underpin the commodity-linked Loonie and exert some downward pressure on the USD/CAD pair. Traders now look to the monthly Canadian GDP report and the US US Personal Consumption Expenditure (PCE) data for a fresh impetus later during the early North American session.

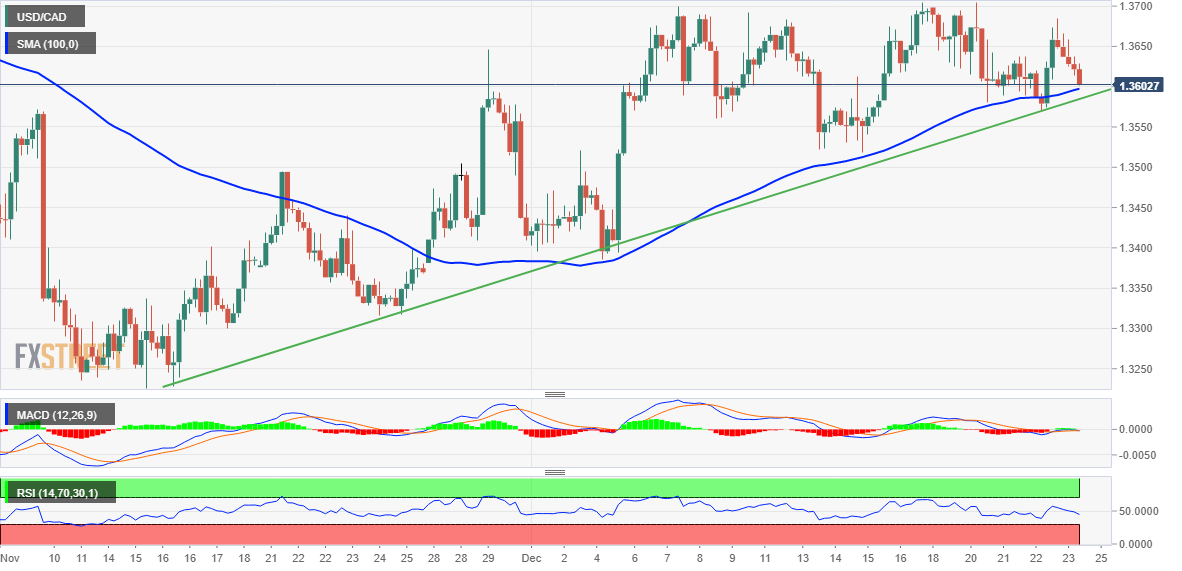
From a technical perspective, the USD/CAD pair is currently hovering just above confluence support, comprising the 100-period SMA on the 4-hour chart and a six-week-old ascending trend-line. Given that oscillators on hourly charts have been drifting lower in bearish territory and losing traction on the daily chart, a convincing break below will be seen as a fresh trigger for bearish trades.

Some follow-through selling below the weekly low, around the 1.3570 region touched on Thursday, will reaffirm the negative bias and make the USD/CAD pair vulnerable. Spot prices could then accelerate the fall towards testing the 1.3500 psychological mark. The downward trajectory could get extended towards the 1.3455-1.3450 intermediate support en route to the 1.3400 round figure (100-day SMA).

On the flip side, the 1.3650 area now seems to act as an immediate resistance. A sustained move above could allow the USD/CAD pair to make a fresh attempt to conquer the 1.3700 mark. Some follow-through buying will be seen as a fresh bullish breakout and lift spot prices towards the 1.3745-1.3750 hurdle en route to the November monthly swing high, around the 1.3800-1.3810 region.

USD/CAD 4-hour chart

fxsoriginal

Key levels to watch

USD/CAD

Overview
Today last price1.3607
Today Daily Change-0.0032
Today Daily Change %-0.23
Today daily open1.3639
 
Trends
Daily SMA201.3577
Daily SMA501.3549
Daily SMA1001.34
Daily SMA2001.3091
 
Levels
Previous Daily High1.3685
Previous Daily Low1.3571
Previous Weekly High1.3705
Previous Weekly Low1.3518
Previous Monthly High1.3808
Previous Monthly Low1.3226
Daily Fibonacci 38.2%1.3641
Daily Fibonacci 61.8%1.3614
Daily Pivot Point S11.3578
Daily Pivot Point S21.3518
Daily Pivot Point S31.3465
Daily Pivot Point R11.3692
Daily Pivot Point R21.3745
Daily Pivot Point R31.3806

Author

Haresh Menghani

Haresh Menghani is a detail-oriented professional with 10+ years of extensive experience in analysing the global financial markets.

More from Haresh Menghani
Share:

Editor's Picks

EUR/USD climbs to daily highs near 1.1820

EUR/USD now picks up pace and advances to the area of daily peaks north of the 1.1800 barrier at the end of the week. The pair’s decent move higher comes against the backdrop of a generalised lack of direction in the FX galaxy and the mild offered stance in the US Dollar.

GBP/USD trims losses, retests 1.3460

After briefly challenging its key 200-day SMA near 1.3440, GBP/USD now manages to regain some balance and revisit the 1.3460 zone on Friday. Cable’s pullback comes as the selling pressure on the Greenback gathers traction, reigniting some recovery in the risk-linked space.

Gold flirts with four-week highs past $5,200

Gold extends its rebound, climbing for a third consecutive session and pushing back above the $5,200 mark per troy ounce on Friday. The move higher continues to draw support from lingering geopolitical tensions and the ongoing uncertainty surrounding US trade policy, both of which are keeping safe-haven demand firmly in play.

Bitcoin, Ethereum and Ripple consolidate with short-term cautious bullish bias

Bitcoin, Ethereum and Ripple are consolidating near key technical areas on Friday, showing mild signs of stabilization after recent volatility. BTC holds above $67,000 despite mild losses so far this week, while ETH hovers around $2,000 after a rejection near its upper consolidation boundary. 

Breaking: US and Israel attack Iran, risk aversion to sweep global markets

Early Saturday, United States (US) President Donald Trump announced that the US had begun “major combat operations” in Iran, following Israel’s pre-emptive missile attacks against Tehran.

Starknet unveils strkBTC, shielded Bitcoin transactions on Ethereum Layer 2

Starknet, the Ethereum Layer 2 network developed by StarkWare, today announced strkBTC, a wrapped Bitcoin asset that introduces optional shielding while preserving full DeFi composability.