|

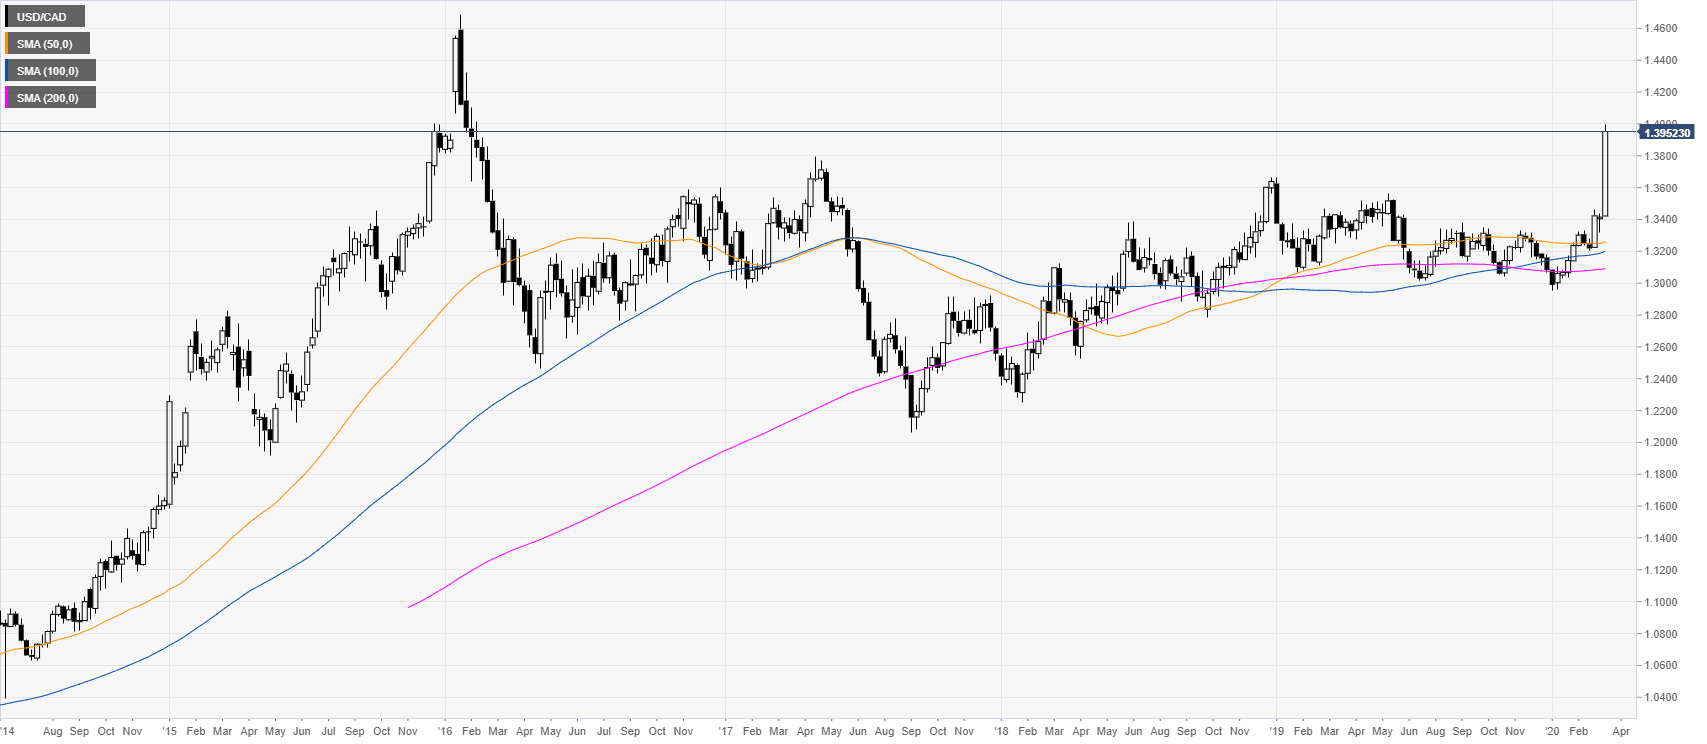
USD/CAD Price Analysis: Dollar trades in 49-month highs, best weekly gains since early 2015

  • USD/CAD is on track to record one of its best weekly advances since January 2015.
  • USD/CAD is trading at levels not seen since February 2016. 
  • USD/CAD is challenging the 1.1400 figure as bulls are relentless.


USD/CAD daily chart

 
USD/CAD is massively breaking out to the upside trading into levels not seen since February 2016 as the market is challenging the 1.1400 figure. The oil crash is sending CAD down. 
 

USD/CAD daily chart

 
USD/CAD is spiking up strongly like it was not seen in the last five years. Bulls are challenging the 1.3972/1.4000 resistance zone. The spike up can extend towards the 1.4100 level and above according to the Technical Confluences Indicator. Resistance can be expected near 1.3914 and 1.3871 levels.
 
 
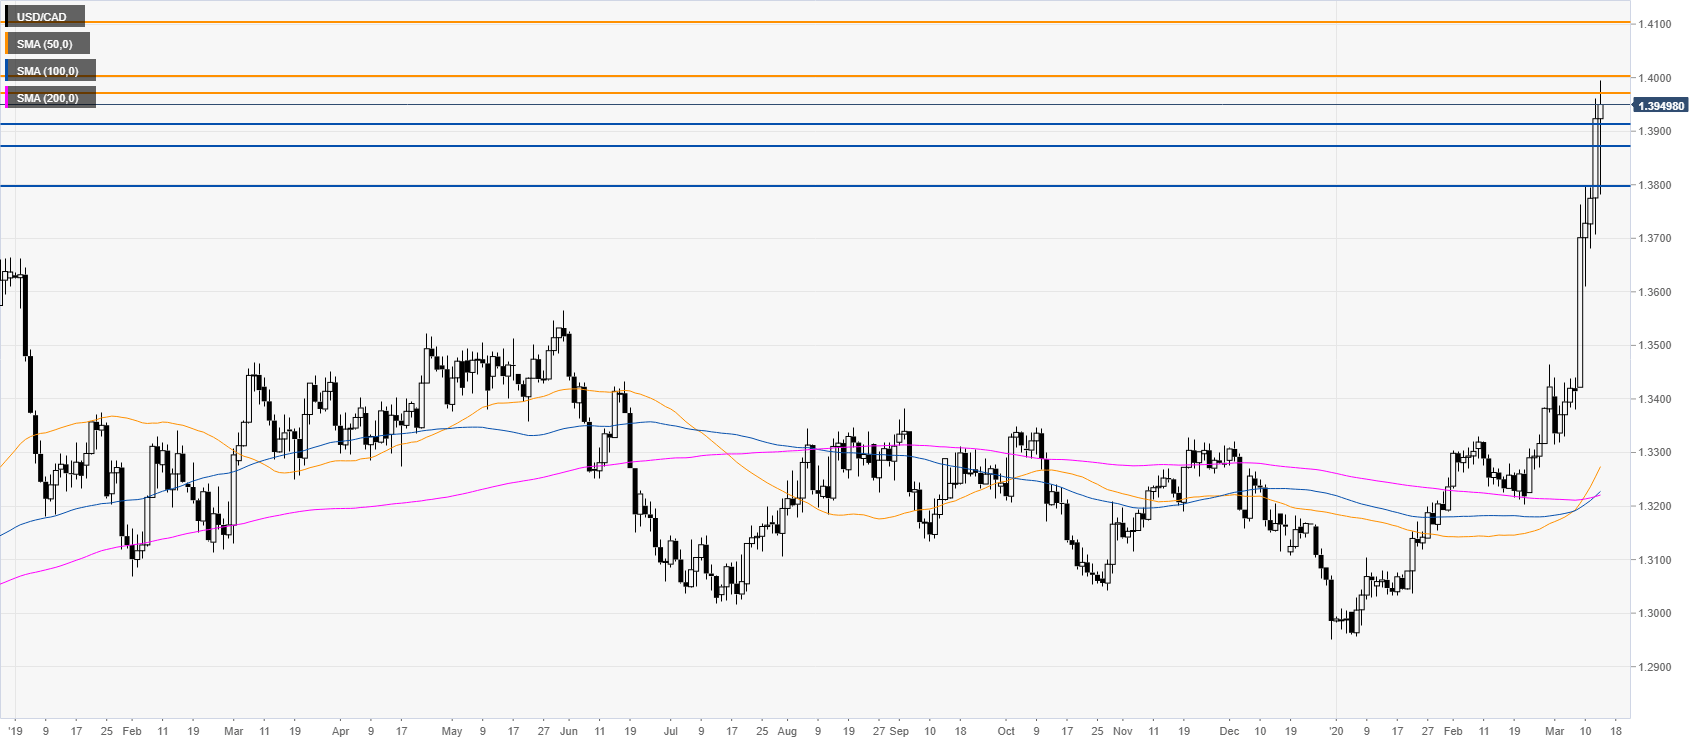
Resistance: 1.3972, 1.4000, 1.4100
Support: 1.3914, 1.3871, 1.3800 
 

Additional key levels

USD/CAD

Overview
Today last price1.395
Today Daily Change0.0027
Today Daily Change %0.19
Today daily open1.3923
 
Trends
Daily SMA201.3411
Daily SMA501.3255
Daily SMA1001.3219
Daily SMA2001.3217
 
Levels
Previous Daily High1.3961
Previous Daily Low1.3708
Previous Weekly High1.344
Previous Weekly Low1.3315
Previous Monthly High1.3465
Previous Monthly Low1.3202
Daily Fibonacci 38.2%1.3864
Daily Fibonacci 61.8%1.3805
Daily Pivot Point S11.3767
Daily Pivot Point S21.361
Daily Pivot Point S31.3513
Daily Pivot Point R11.4021
Daily Pivot Point R21.4118
Daily Pivot Point R31.4274

Author

Flavio Tosti

Flavio Tosti

Independent Analyst


More from Flavio Tosti
Share:

Editor's Picks

EUR/USD keeps the offered stance just above 1.1700

EUR/USD is coming under heavy selling pressure in what has been a rather grim start to the new trading week, with the pair now trading close to the 1.1700 support area as the US Dollar stages a solid rebound. The prevailing flight to safety mood continues to favour the Greenback, as investors react to the escalating conflict in the Middle East and trim risk exposure across the board.

GBP/USD hits new yearly lows near 1.3300

GBP/USD adds to the recent bearish tone, approaching to the key 1.3300 support to reach fresh YTD troughs against the backdrop of the robust performance of the US Dollar. Indeed, Cable’s decline comes amid the firm demand for the safe-haven space in the wake of the US and Israel attacks to Iran.

Gold battles to retain the positive momentum

Gold now surrenders part of the earlier advance past the $5,400 mark per troy ounce at the beginning of the week. Indeed, the precious metal’s strong uptick remains fuelled by increasing geopolitical tensions in the Middle East amid the intense demand for safer assets.

Bitcoin on brink of breakdown amid US-Iran war

Bitcoin (BTC) remains under pressure near the key support level of $65,700. Trading at $66,400 at the time of writing on Monday, a breakdown below this critical level would suggest a deeper correction ahead.

The Fed is finally talking about AI – Here's why it matters for the US Dollar

AI is moving from earnings calls into the heart of monetary policy discussions, forcing Federal Reserve officials to confront a new question: How to act if AI reshapes inflation, employment and interest rates at the same time?

Grass 20% bullish breakout defies broader market weakness

Grass (GRASS) is edging up above $0.30 at the time of writing on Monday. The token’s notable 20% intraday surge stands out amid heightened volatility in the broader crypto market.