|

USD/CAD Price Analysis: Clings to modest gains above 1.2100 mark, bearish bias remains

  • A combination of factors assisted USD/CAD to stage a modest recovery from near four-year lows.
  • Oversold RSI on the daily chart seemed to be the only factor that prompted some short-covering.
  • The technical set-up still favours bearish traders and supports prospects for additional weakness.

The USD/CAD pair edged higher during the early North American session and refreshed daily tops, around the 1.2125 region in the last hour, albeit lacked follow-through.

Declining crude oil prices – now down over 1.30% for the day – undermined the commodity-linked loonie and extended some support to the USD/CAD pair. On the other hand, a modest uptick in the US Treasury bond yields extended some support to the US dollar. Apart from this, a steep fall in the equity markets further benefitted the greenback's relative safe-haven status against its Canadian counterpart.

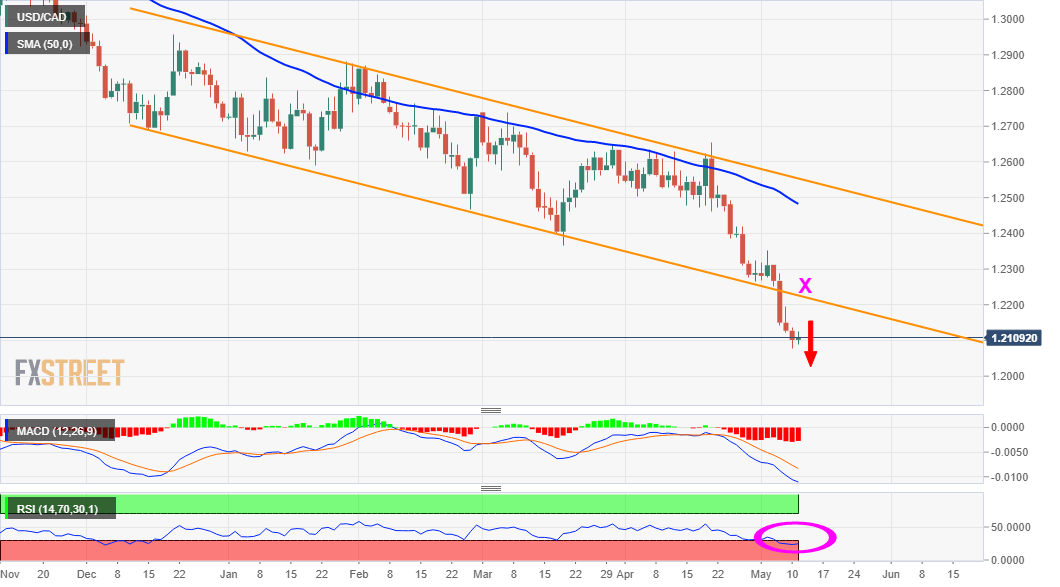
From a technical perspective, oversold RSI on the daily chart was seen as a key factor that prompted some short-covering move and assisted the USD/CAD pair to snap four days of the losing streak. That said, last week's sustained break below a multi-month descending channel supports prospects for an extension of the well-established bearish trend. This suggests that the attempted recovery might fizzle out quickly.

Hence, any subsequent positive move towards the 1.2145-50 region might be seen as an opportunity to initiate fresh bearish positions. This, in turn, should cap the USD/CAD pair near the mentioned trend-channel support breakpoint, now turned resistance near the 1.2200 round-figure mark. The mentioned handle should now act as a key pivotal point for short-term traders and help determine the near-term trajectory.

On the flip side, the 1.2100 mark now seems to protect the immediate downside ahead of the 1.2080-75 region, or near four-year lows touched on Monday. This is closely followed by September 2017 swing lows, around the 1.2060 region, which if broken decisively should pave the way for additional weakness. The USD/CAD pair might then turn vulnerable and accelerate the fall to challenge the key 1.2000 psychological mark.

USD/CAD daily chart

fxsoriginal

Technical levels to watch

USD/CAD

Overview
Today last price1.211
Today Daily Change0.0009
Today Daily Change %0.07
Today daily open1.2101
 
Trends
Daily SMA201.2383
Daily SMA501.2493
Daily SMA1001.261
Daily SMA2001.2867
 
Levels
Previous Daily High1.2137
Previous Daily Low1.2079
Previous Weekly High1.2352
Previous Weekly Low1.2122
Previous Monthly High1.2654
Previous Monthly Low1.2266
Daily Fibonacci 38.2%1.2101
Daily Fibonacci 61.8%1.2115
Daily Pivot Point S11.2075
Daily Pivot Point S21.2048
Daily Pivot Point S31.2017
Daily Pivot Point R11.2132
Daily Pivot Point R21.2163
Daily Pivot Point R31.219

Author

Haresh Menghani

Haresh Menghani is a detail-oriented professional with 10+ years of extensive experience in analysing the global financial markets.

More from Haresh Menghani
Share:

Editor's Picks

GBP/USD appears well offered near 1.3160

GBP/USD builds on Tuesday’s losses, although it now manages to pick up some pace and bounce off earlier multi-month troughs near 1.3140. The Greenback’s solid performance and continued political turmoil in the UK are keeping Cable under persistent pressure, with little sign of a meaningful recovery.

EUR/USD rebounds from lows, back to 1.1360

After bottoming out near 1.1320, EUR/USD gathers some traction and reclaims the 1.1350-1.1360 band as the NA session draws to a close on Wednesday. The pair’s drop to multi-month lows comes in response to the continuous leg higher in the US Dollar, which remains propped up by hawkish Fed expectations and uncertainty over the outcome of US-Iran peace negotiations.

Gold pressured near fresh 2026 lows

Gold accelerates its decline and gyrates around the key $4,000 mark per troy ounce on Wednesday, its lowest level since November 2025. In the meantime, tighter-for-longer Fed expectations and a broadly firmer US Dollar continue to weigh on the yellow metal, while uncertainty surrounding a potential US-Iran peace agreement has done little to revive demand for the safe haven space.

XRP nears key support as Fed hike risks suppress demand
Ripple (XRP) continues to face significant selling pressure, trading around $1.05 at the time of writing on Wednesday. This decline mirrors the broader weakness in the crypto market, exacerbated by mounting macroeconomic headwinds and persistent geopolitical uncertainties.
US-Iran talks: The next 60 days will decide where Oil prices go next
Oil markets received some encouraging news after weeks of rising tensions in the Middle East. But let’s not get ahead of ourselves: we’re far from victory, and markets just seem to have priced out the worst-case scenario. The US and Iran have reportedly made "substantive progress" in talks in Switzerland and agreed on a framework for working toward a broader deal within 60 days.
Regime change: Inside Kevin Warsh's first move to make the Fed unreadable on purpose

The rate did not move. That was the least interesting thing about Kevin Warsh's first meeting in charge of the Fed. The FOMC held its benchmark at 3.50%-3.75% for the fourth straight meeting, exactly as priced, and then the new chair used his first press conference to dismantle the machinery the market has leaned on for a decade.