US stock indexes see lopsided gains on Thursday, but end the day broadly in the green
- Major equity indexes in the US trade mixed after opening in positive territory.
- Retail Sales in the US declined by 0.8% in January.
- Technology stocks underperform and weigh on Nasdaq Composite.

The S&P 500 (SPX) index rose 0.58% to close the session at 5,029.73. The Dow Jones (DJIA) climbed 0.91% to end at 38,773.12, while the Nasdaq (IXIC) gained 0.30% to finish at 15,906.17.
Stock market news
- The Energy Sector gained nearly 2.5% as the strongest sector of the S&P 500 on Thursday, followed closely by the Real Estate Sector, which added 2.36% for the day.
- The Technology Sector ended Thursday as the worst-performing sector of the S&P 500, shedding 0.44%.
- Zebra Technologies Corp. (ZBRA) gained 12.172% on the day, ending at $283.75. West Pharmaceutical Services Inc. (WST) took the top spot on the biggest decliners board, with shares are down over 14% after the close at $350.70.
- The CBOE Volatility Index (VIX), Wall Street's fear gauge, is up 1% after falling 9.3% on Wednesday.
- Retail Sales in the US declined by 0.8% to $700.3 billion in January, the US Census Bureau reported on Thursday. This reading came in weaker than the market expectation for a decrease of 0.1%. Retail Sales ex Autos contracted by 0.6% in the same period.
- There were 212,000 first-time applications for unemployment benefits in the week ending February 10, down from 220,000 in the previous week, the US Department of Labor announced.
- Inflation in the US, as measured by the change in the Consumer Price Index (CPI), softened to 3.1% on a yearly basis in January from 3.4% in December, the US Bureau of Labor Statistics (BLS) reported on Tuesday. This reading came in above the market expectation of 2.9%.
- The Core CPI, which excludes volatile food and energy prices, rose 3.9% in the same period and matched December's increase, surpassing analysts' estimate of 3.7%.
- On Friday, the BLS will release Producer Price Index (PPI) figures.
- According to the CME FedWatch Tool, there is a nearly 40% probability of a Federal Reserve (Fed) rate cut in May, down from nearly 55% ahead of the January inflation data.
- On Tuesday, Coca-Cola Co. (KO) reported that revenue rose 7.4% to $10.95 billion from a year ago for the quarter ended in December, per Reuters. The company announced that the quarterly net income was $1.97 billion for that period and cited higher product prices and robust demand for the upbeat results.
- Airbnb Inc. (ABNB) said after the closing bell on Tuesday that quarterly adjusted earnings were 76 cents per share in the quarter ended in December. The company’s revenue increased 16.6% to $2.22 billion from a year ago, but there was a quarterly loss of $349 million.
- Cisco Systems Inc. (CSCO) announced quarterly adjusted earnings per share were 87 cents in the quarter ended in January. The networking equipment manufacturer said the revenue fell 5.9% to $12.79 billion from a year ago, while the quarterly net income was $2.63 billion in the same period. In a conference call, CEO Charles Robbins said, "we also continue to see weak demand with our telco and cable service provider customers," per Reuters. The company is reportedly planning to cut more than 4,000 jobs and focus on high-growth areas such as artificial intelligence and software.
- Applied Materials, Inc (AMAT), DoorDash Inc. (DASH) and Coinbase Global Inc. (COIN) are among top companies that will report quarterly earnings after the closing bell on Thursday.
S&P 500 5-minute chart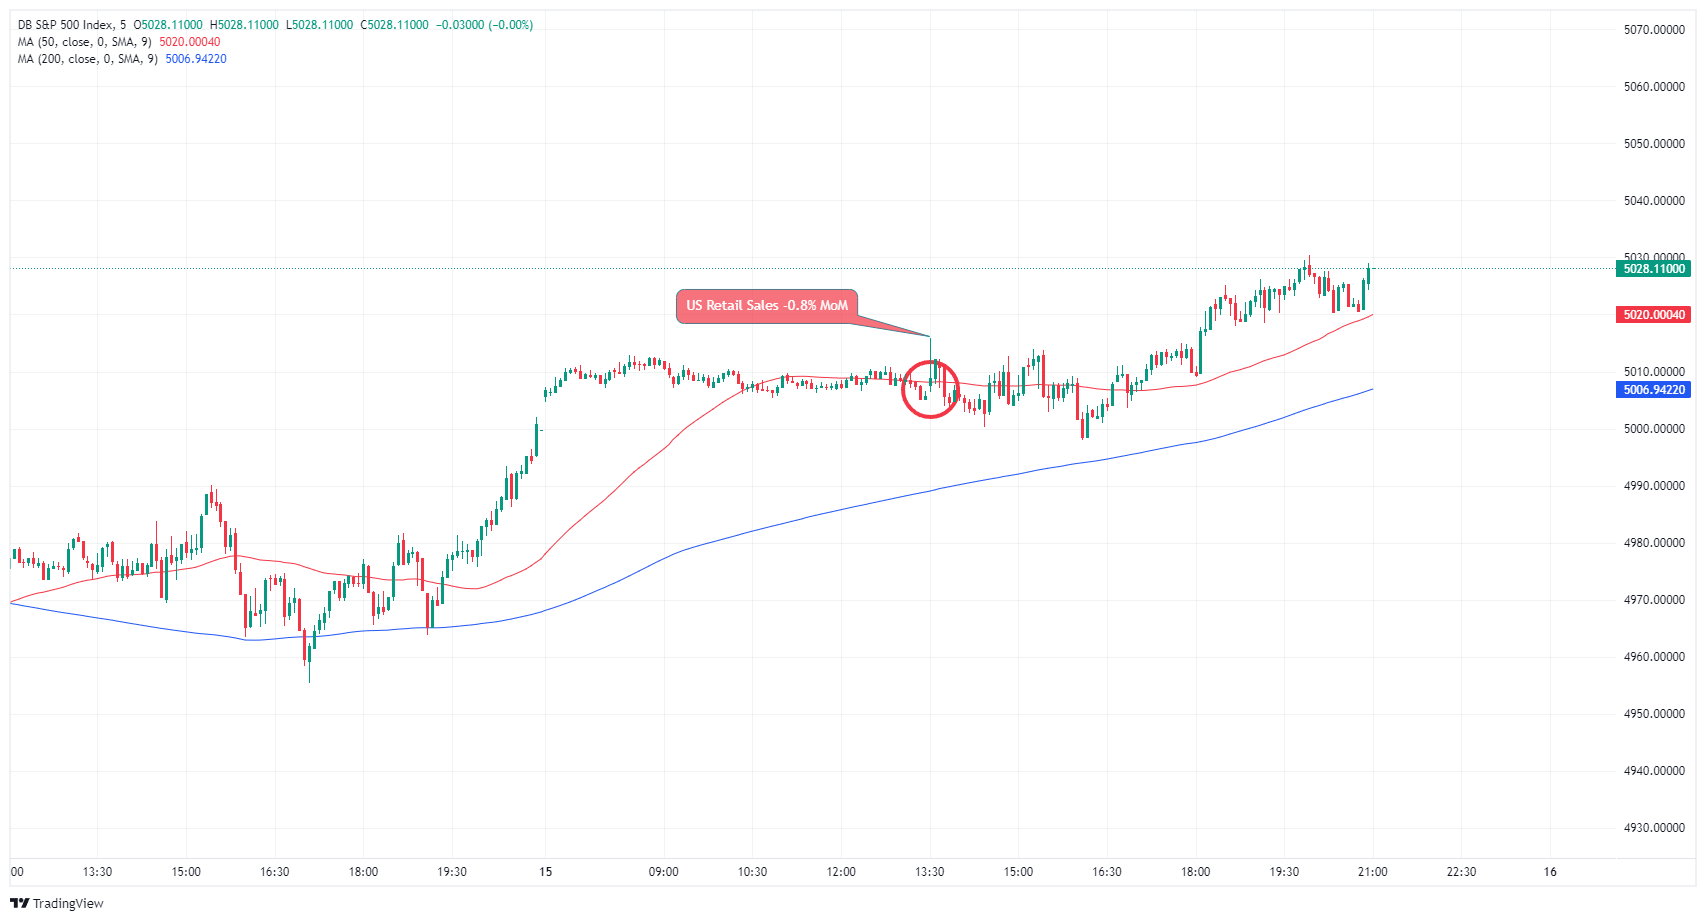
S&P 500 FAQs
What is the S&P 500?
The S&P 500 is a widely followed stock price index which measures the performance of 500 publicly owned companies, and is seen as a broad measure of the US stock market. Each company’s influence on the computation of the index is weighted based on market capitalization. This is calculated by multiplying the number of publicly traded shares of the company by the share price. The S&P 500 index has achieved impressive returns – $1.00 invested in 1970 would have yielded a return of almost $192.00 in 2022. The average annual return since its inception in 1957 has been 11.9%.
How are companies chosen to be included in the S&P 500?
Companies are selected by committee, unlike some other indexes where they are included based on set rules. Still, they must meet certain eligibility criteria, the most important of which is market capitalization, which must be greater than or equal to $12.7 billion. Other criteria include liquidity, domicile, public float, sector, financial viability, length of time publicly traded, and representation of the industries in the economy of the United States. The nine largest companies in the index account for 27.8% of the market capitalization of the index.
How can I trade the S&P 500?
There are a number of ways to trade the S&P 500. Most retail brokers and spread betting platforms allow traders to use Contracts for Difference (CFD) to place bets on the direction of the price. In addition, that can buy into Index, Mutual and Exchange Traded Funds (ETF) that track the price of the S&P 500. The most liquid of the ETFs is State Street Corporation’s SPY. The Chicago Mercantile Exchange (CME) offers futures contracts in the index and the Chicago Board of Options (CMOE) offers options as well as ETFs, inverse ETFs and leveraged ETFs.
What factors drive the S&P 500?
Many different factors drive the S&P 500 but mainly it is the aggregate performance of the component companies revealed in their quarterly and annual company earnings reports. US and global macroeconomic data also contributes as it impacts on investor sentiment, which if positive drives gains. The level of interest rates, set by the Federal Reserve (Fed), also influences the S&P 500 as it affects the cost of credit, on which many corporations are heavily reliant. Therefore, inflation can be a major driver as well as other metrics which impact the Fed decisions.
Author
FXStreet Team
FXStreet
Composed of a group of economic journalists and FX experts, the FXStreet content team produces and oversees all content published on FXStreet. It provides a purely journalistic approach to the Forex market.


