US equities climb into fresh all-time highs as stocks extend risk rally through Monday
- US stocks ticked up higher once more on Monday as risk-on mood continues.
- Friday’s all-time highs gave way to further gains to kick off the new trading week.
- US PCE inflation to be a critical data print this week for Fed expectations.
US stocks climbed broadly higher on Monday, etching in fresh all-time highs as last week’s late break into record prices carried over into the new trading week, with tech stocks leading the way higher and sending the Dow Jones Industrial Average (DJIA) over the $38,000.00 valuation for the first time ever.
The Standard & Poor’s (S&P) 500 major equity index continues its march towards $5,000.00, ending Monday at $4,850.43 after hitting a new record high of $4,866.05 as investors continue to pile into stock bets.
Stock indexes shrugged off bearish sentiment that plagued investor confidence through 2024’s early trading with investors hurting after over-eager market expectations of fast and furious rate cuts from the Federal Reserve (Fed) giving way to investor bets of Fed rate adjustments falling closer to something resembling reality.
According to the CME’s FedWatch tool, Fed rate swaps are pricing in less than 60% odds of a first rate cut from the Fed at the Federal Open Market Committee’s March meeting and subsequent rate call, down from over 80% only a month ago.
The Dow Jones Industrial Average claimed the $38,000.00 major handle on Monday, climbing 138.01 points to end the day up 0.36%, while the S&P 500 pinged $4,850.43, climbing 10.62 points to close up by 0.22%.
The NASDAQ Composite Index ended Monday at $15,360.29, gaining 49.32 points on the day and closing in the green by 0.32%, and the NASDAQ 100 major equity index also gained 16.38 points to end Monday 0.09% higher at $17,330.38.
S&P 500 Technical Outlook
The S&P 500 extended recent gains, climbing to 3.22% above last week’s swing low into $4,714.37. Intraday action has run out of technical barriers to the high side as bids ping all-time highs, but near-term technical indicators are flashing overbought conditions with the Relative Strength Index (RSI) and Moving Average Convergence-Divergence (MACD) rotating into downside momentum from overbought conditions on the hourly candle charts.
The S&P 500 has closed in the green for all but one of the last 12 consecutive trading weeks, and is up nearly 19% after October’s dip into the Simple Moving Average (SMA) and testing $4,102.02.
S&P 500 Hourly Chart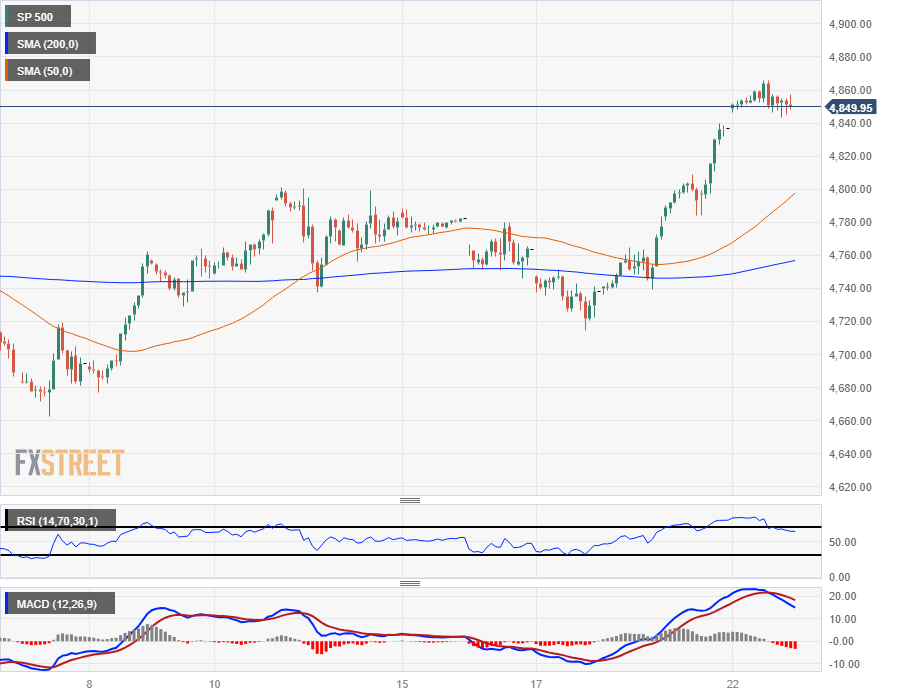
S&P 500 Daily Chart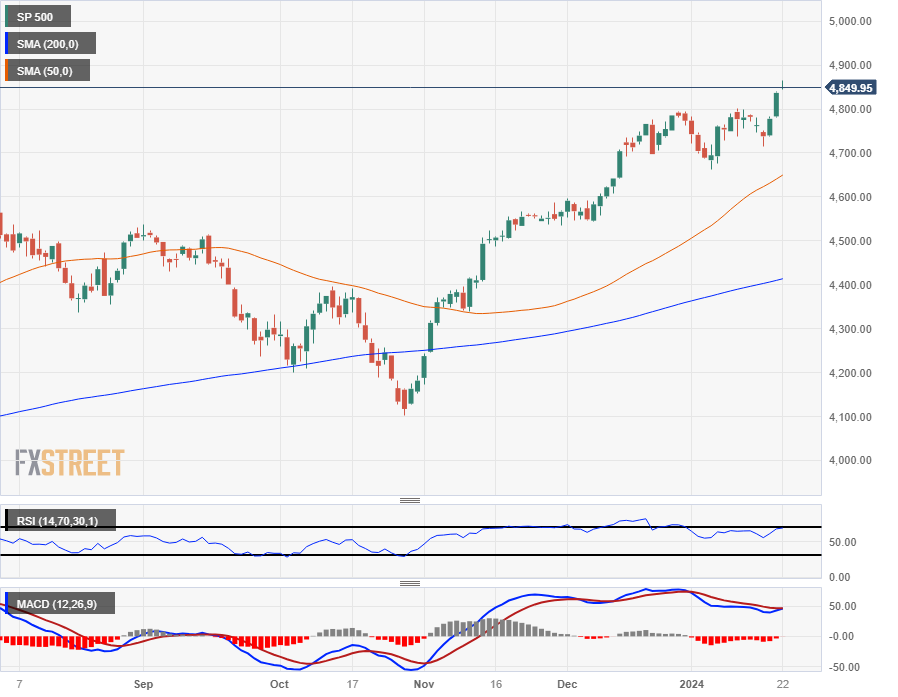
Author

Joshua Gibson
FXStreet
Joshua joins the FXStreet team as an Economics and Finance double major from Vancouver Island University with twelve years' experience as an independent trader focusing on technical analysis.


