|

US Dollar Index technical analysis: DXY waiting for a catalyst

  • The Greenback is trapped in a triangle pattern as the market is waiting for a catalyst. 
  • The level to beat for bulls is the 98.55/98.66 resistance zone.
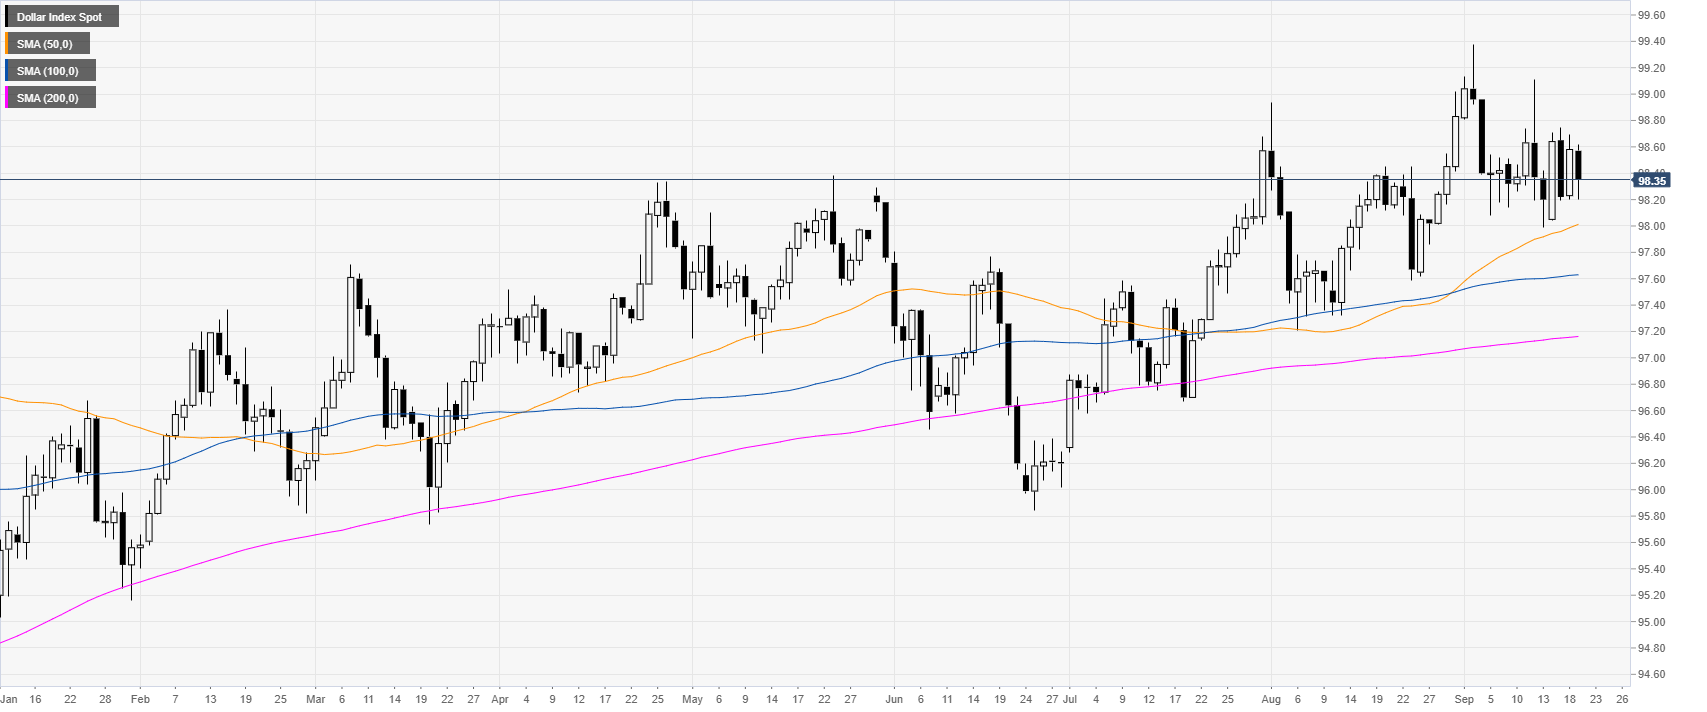


DXY daily chart


DXY (US Dollar Index) is trading in a bull trend above its main daily simple moving averages (DSMAs). In the last two weeks, the Greenback has been trading in a trading range revolving around the 98.40 level. 
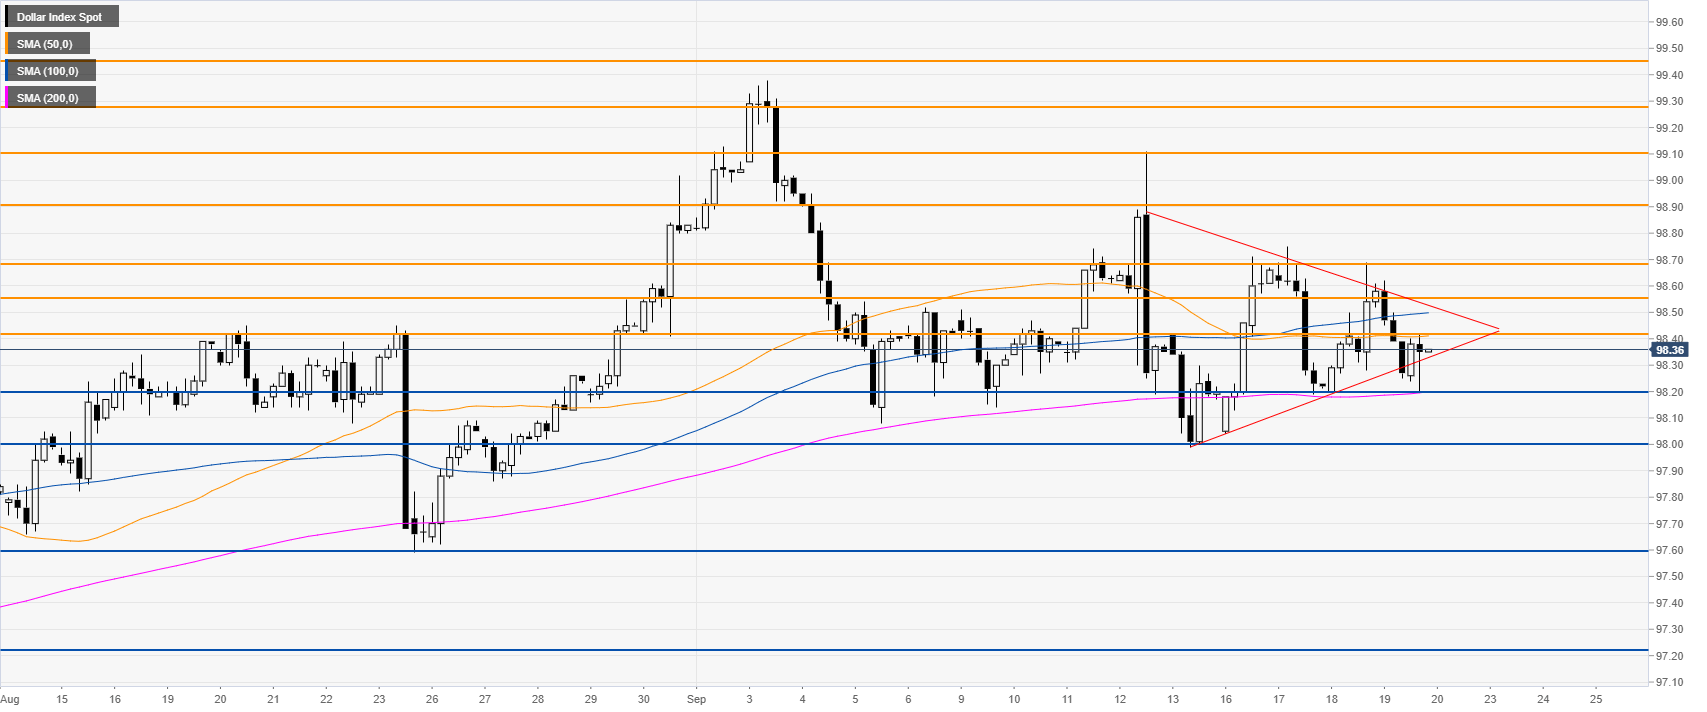
 

DXY four-hour chart

 
DXY is ranging above the 98.20 support and the 200 SMA. DXY is forming a triangle pattern with a potential breakout in either direction, although the primary bias is to the upside. 
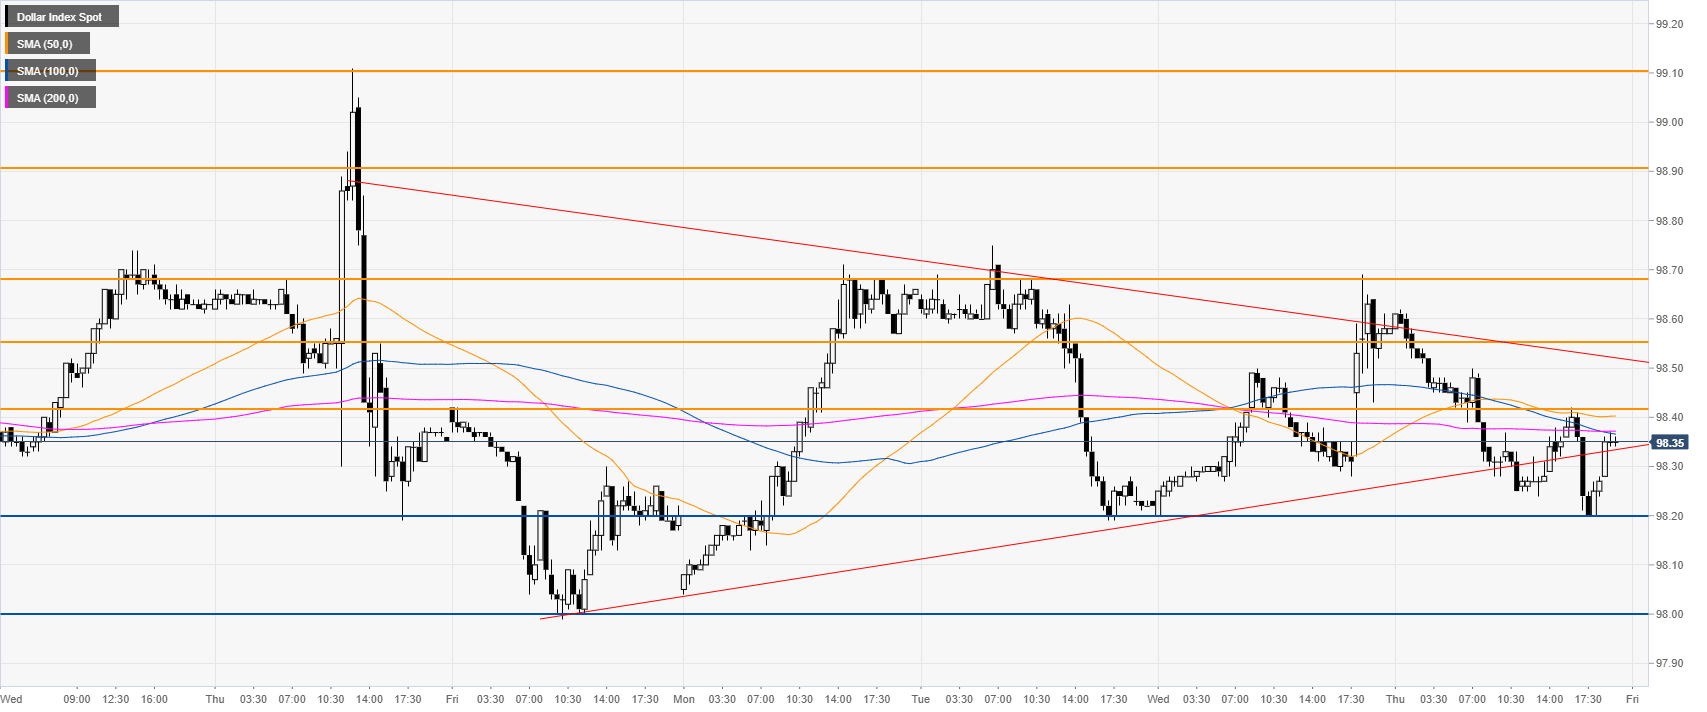
 

DXY 30-minute chart

 
DXY bulls would need a break above the 98.55/98.68 resistance zone to pull away from the triangle pattern. On the flip side, bears need to overcome the 98.20/98.00 support zone. 
 

Additional key levels

Dollar Index Spot

Overview
Today last price98.35
Today Daily Change-0.23
Today Daily Change %-0.23
Today daily open98.58
 
Trends
Daily SMA2098.4
Daily SMA5097.99
Daily SMA10097.63
Daily SMA20097.16
 
Levels
Previous Daily High98.69
Previous Daily Low98.2
Previous Weekly High99.11
Previous Weekly Low97.99
Previous Monthly High99.02
Previous Monthly Low97.21
Daily Fibonacci 38.2%98.5
Daily Fibonacci 61.8%98.39
Daily Pivot Point S198.29
Daily Pivot Point S298
Daily Pivot Point S397.8
Daily Pivot Point R198.78
Daily Pivot Point R298.98
Daily Pivot Point R399.27

Author

Flavio Tosti

Flavio Tosti

Independent Analyst


More from Flavio Tosti
Share:

Editor's Picks

EUR/USD holds firm near 1.1850 amid USD weakness

EUR/USD remains strongly bid around 1.1850 in European trading on Monday. The USD/JPY slide-led broad US Dollar weakness helps the pair build on Friday's recovery ahead of the Eurozone Sentix Investor Confidence data for February. 

GBP/USD hovers near 1.3600 as UK government crisis weighs on Pound Sterling

GBP/USD moves sideways after registering modest gains in the previous session, trading around 1.3610 during the European hours on Monday. The pair could come under pressure as the Pound Sterling may weaken amid a fresh government crisis in the United Kingdom.

Gold remains supported by China's buying and USD weakness as traders eye US data

Gold struggles to capitalize on its intraday move up and remains below the $5,100 mark heading into the European session amid mixed cues. Data released over the weekend showed that the People's Bank of China extended its buying spree for a 15th month in January. Moreover, dovish US Fed expectations and concerns about the central bank's independence drag the US Dollar lower for the second straight day, providing an additional boost to the non-yielding yellow metal.

Cardano steadies as whale selling caps recovery

Cardano (ADA) steadies at $0.27 at the time of writing on Monday after slipping more than 5% in the previous week. On-chain data indicate a bearish trend, with certain whales offloading ADA. However, the technical outlook suggests bearish momentum is weakening, raising the possibility of a short-term relief rebound if buying interest picks up.

Japanese PM Takaichi nabs unprecedented victory – US data eyed this week

I do not think I would be exaggerating to say that Japanese Prime Minister Sanae Takaichi’s snap general election gamble paid off over the weekend – and then some. This secured the Liberal Democratic Party (LDP) an unprecedented mandate just three months into her tenure.

Bitcoin, Ethereum and Ripple consolidate after massive sell-off

Bitcoin, Ethereum, and Ripple prices consolidated on Monday after correcting by nearly 9%, 8%, and 10% in the previous week, respectively. BTC is hovering around $70,000, while ETH and XRP are facing rejection at key levels. Traders should be cautious: despite recent stabilization, upside recovery for these top three cryptocurrencies is capped as the broader trend remains bearish.