|

US Dollar Index technical analysis: DXY under pressure near one-week lows

  • DXY is under bearish pressure trading at one-week lows.
  • A break below 98.63 key support could lead to further losses. 
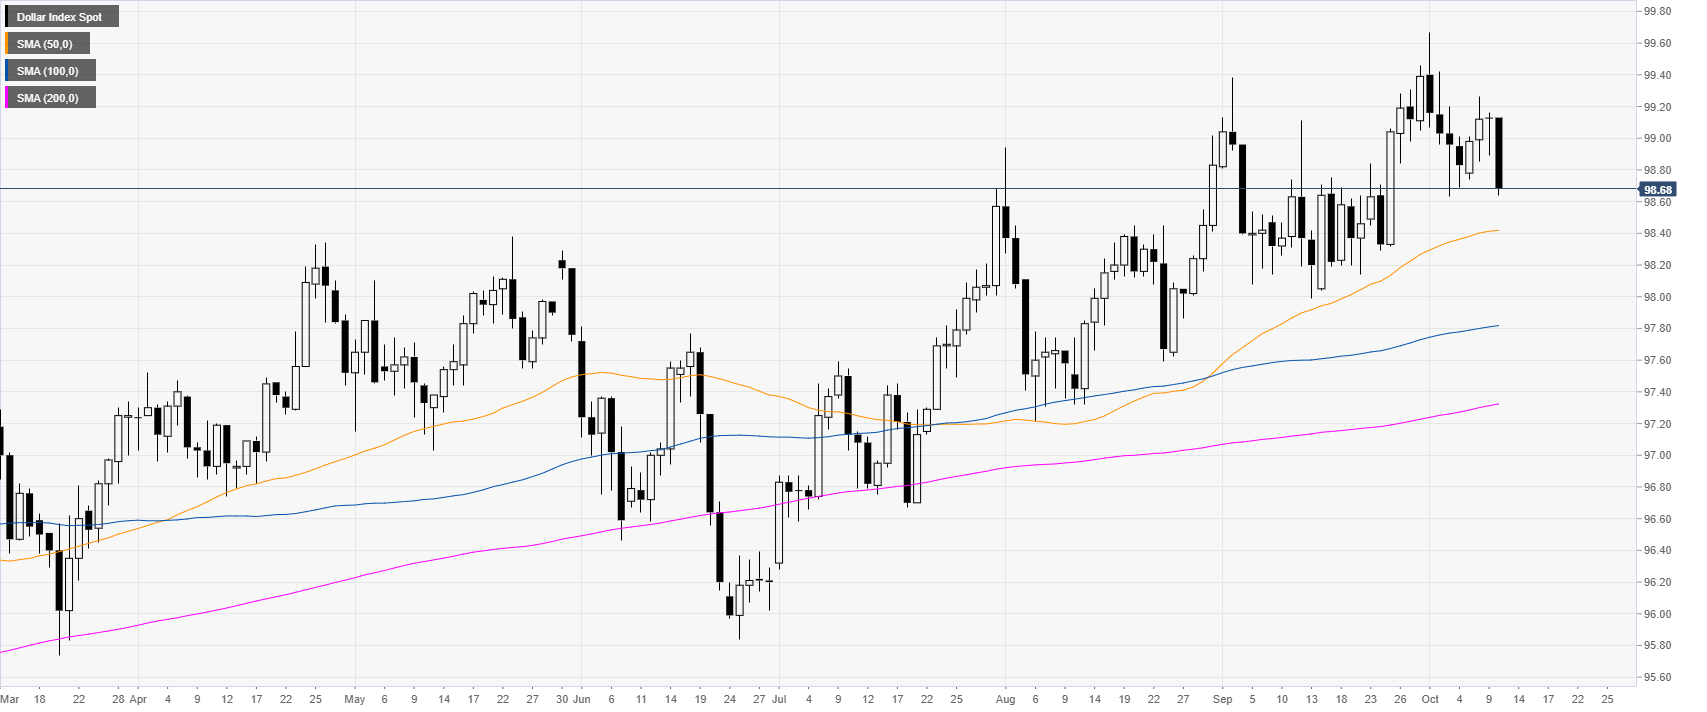
 

DXY daily chart

 
The US Dollar Index (DXY) is in a bull trend above the main daily simple moving averages (DSMAs). Earlier in the New York session, the US Core Consumer Price Index (CPI) matched analysts’ expectations at 2.4% YoY. 
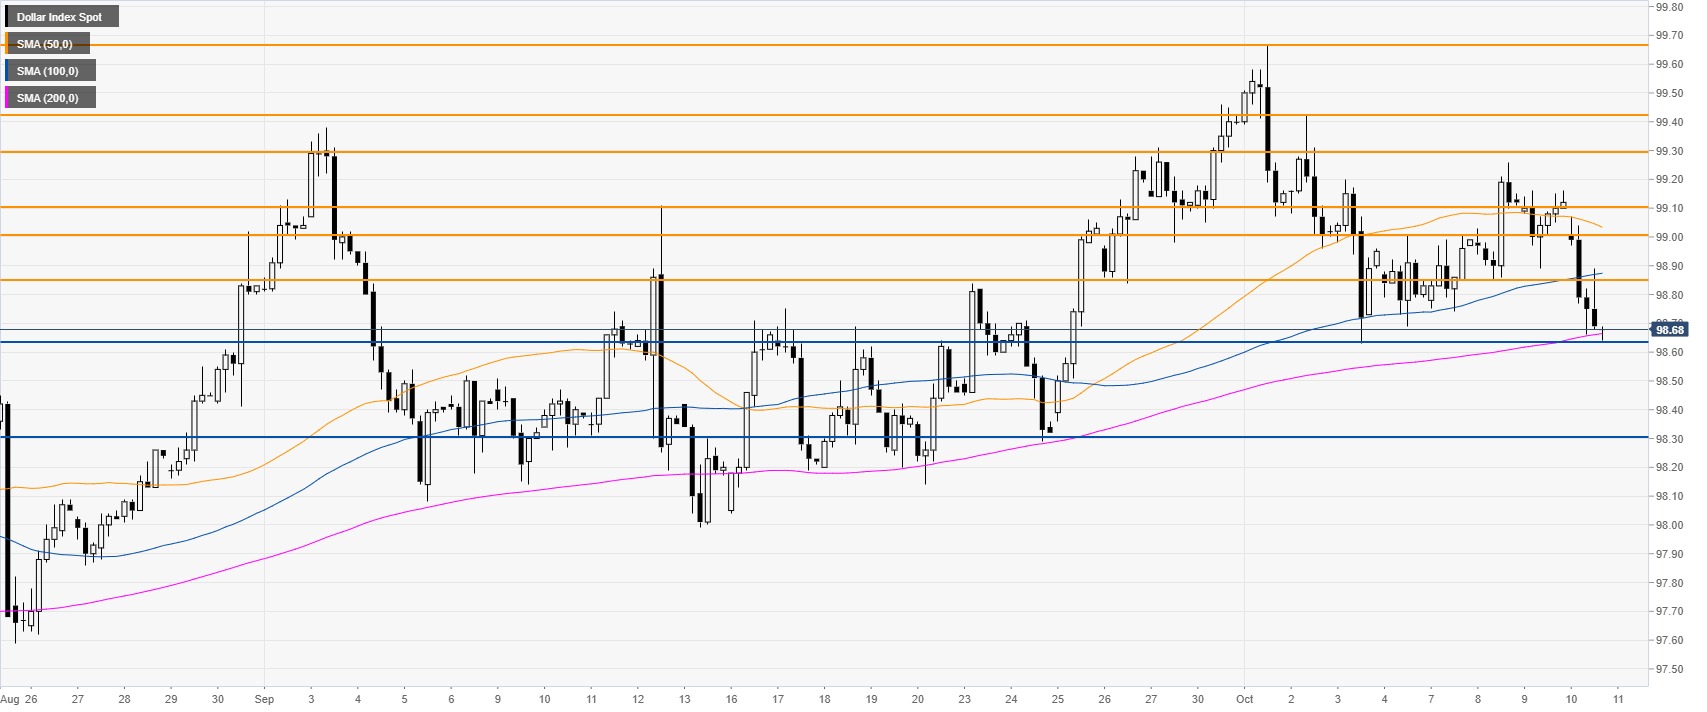
 

DXY four-hour chart

 
DXY is trading at one-week lows, challenging the 96.64 support and the 200 SMA on the four-hour chart. If the market hold above this level DXY is set to remain with the current October range. 
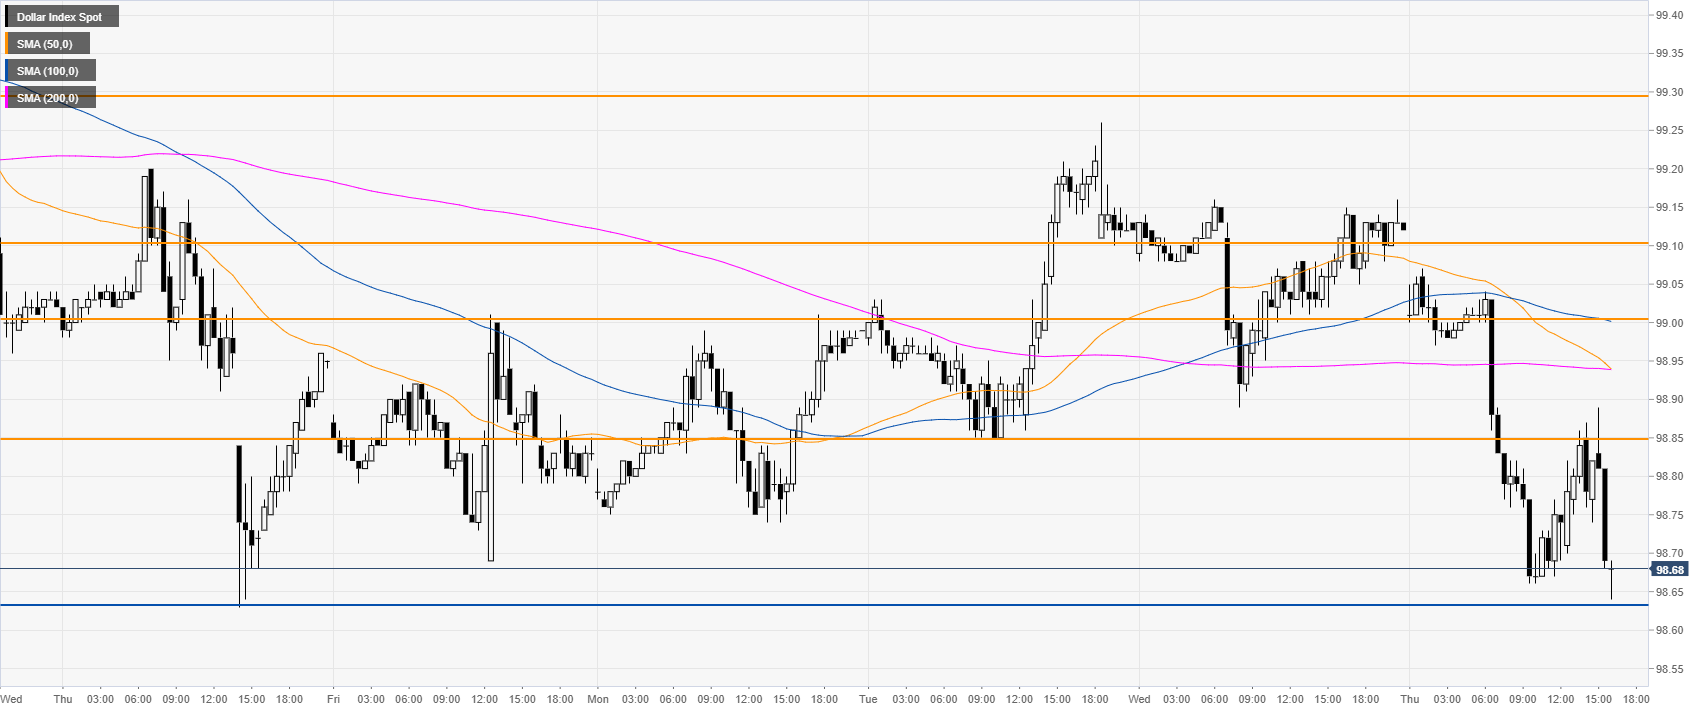


DXY 30-minute chart


DXY is trading below the main SMAs, suggesting bearish momentum in the near term. Resistances are seen at the 98.85 and 99.00 price levels. 


Additional key levels 

Dollar Index Spot

Overview
Today last price98.68
Today Daily Change-0.45
Today Daily Change %-0.45
Today daily open99.13
 
Trends
Daily SMA2098.79
Daily SMA5098.41
Daily SMA10097.81
Daily SMA20097.31
 
Levels
Previous Daily High99.16
Previous Daily Low98.89
Previous Weekly High99.67
Previous Weekly Low98.63
Previous Monthly High99.46
Previous Monthly Low97.99
Daily Fibonacci 38.2%99.06
Daily Fibonacci 61.8%98.99
Daily Pivot Point S198.96
Daily Pivot Point S298.79
Daily Pivot Point S398.69
Daily Pivot Point R199.23
Daily Pivot Point R299.33
Daily Pivot Point R399.5

Author

Flavio Tosti

Flavio Tosti

Independent Analyst


More from Flavio Tosti
Share:

Editor's Picks

EUR/USD remains cautious near 1.1760 ahead of US data

EUR/USD trades marginally on the defensive at the end of the week, hovering around the 1.1770-1.1760 band against the backdrop of an equally humble advance in the US Dollar. Meanwhile, investors gear up for the release of key US data later in the day, including PCE and GDP figures.

GBP/USD looks slightly bid near 1.3480, focus on US docket

The British Pound gathers some fresh steam on Friday, prompting GBP/USD to reverse four consecutive days of losses and revisit the 1.3480 zone. Cable’s decent bounce comes on the back of modest gains in the Greenback prior to the release of significant US data.

Gold extends the recovery past $5,000/oz, looks at US data

Gold prices advance for the third straight day on Friday, reaching new multi-day highs just north of the key $5,000 mark per troy ounce. The continuation of the precious metal’s uptick follows steady geopolitical effervescence in the Middle East, while traders eagerly await key US data releases.

US GDP growth expected to slow down significantly in Q4 after stellar Q3 

The United States Bureau of Economic Analysis will publish the first preliminary estimate of the fourth-quarter Gross Domestic Product at 13:30 GMT. Analysts forecast the US economy to have expanded at a 3% annualized rate, slowing down from the 4.4% growth posted in the previous quarter.

Week ahead – Markets brace for heightened volatility as event risk dominates

Dollar strength dominates markets as risk appetite remains subdued. A Supreme Court ruling, geopolitics and Fed developments are in focus. Pivotal Nvidia earnings on Wednesday as investors question tech sector weakness.

Official Trump price approaches breakout with mixed signals from traders

Official Trump (TRUMP) is trading at $3.50 at the time of writing, approaching its upper consolidation range. A breakout from this range could open the door for an upside move. On-chain data shows market indecision, with balanced flows between bulls and bears, signaling a lack of clear directional bias.