|

US Dollar Index technical analysis: DXY loses steam below the 98.45 level

  • The Greenback is turning bearish breaking below the 98.45 support.
  • The market can weaken to the 98.20 price level. 
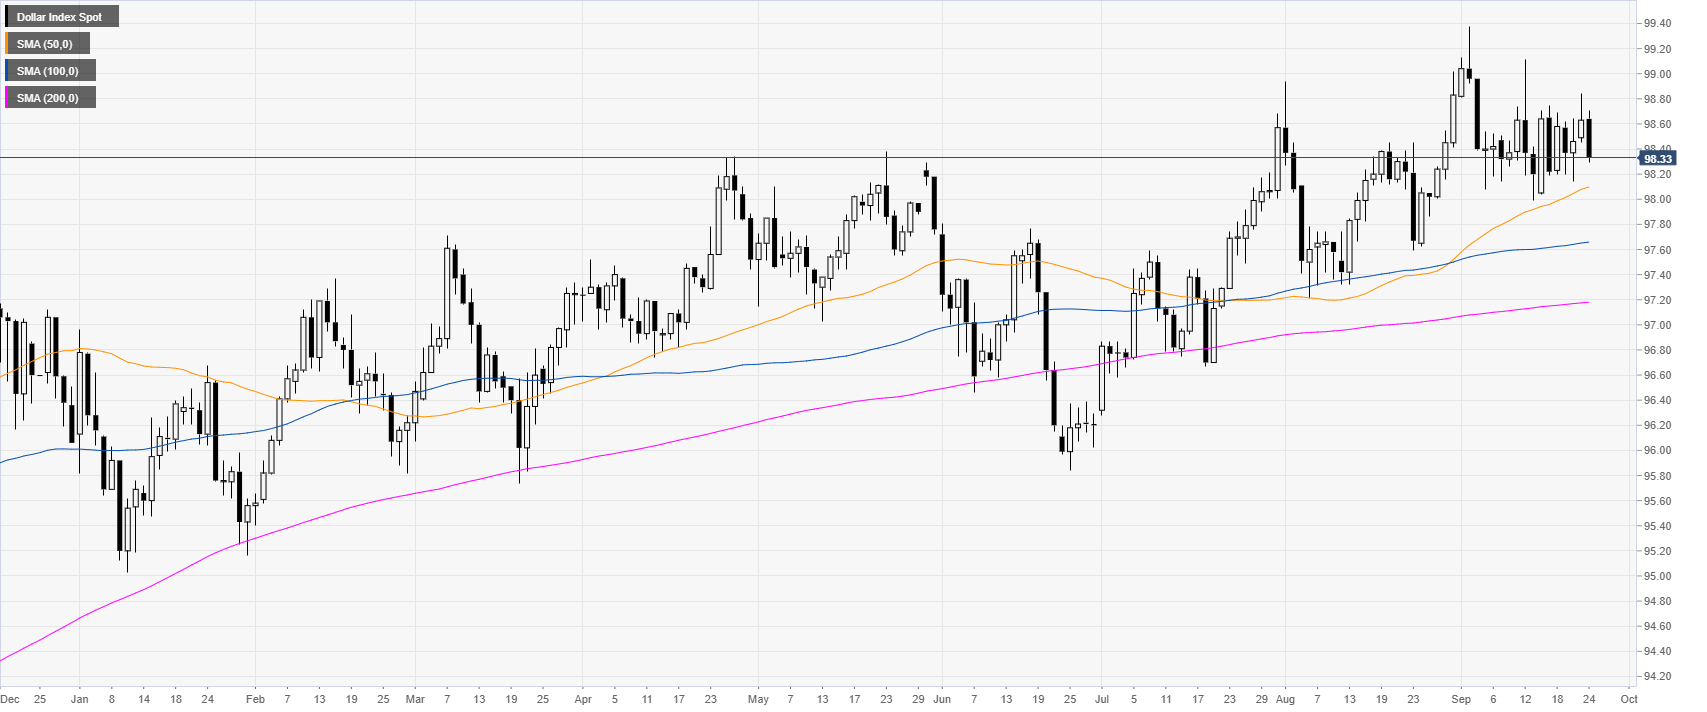


DXY daily chart

 
DXY (US Dollar Index) is in a bull trend above the main daily simple moving averages (DSMAs). However, the Greenback has been trading in a tight range for most of September.
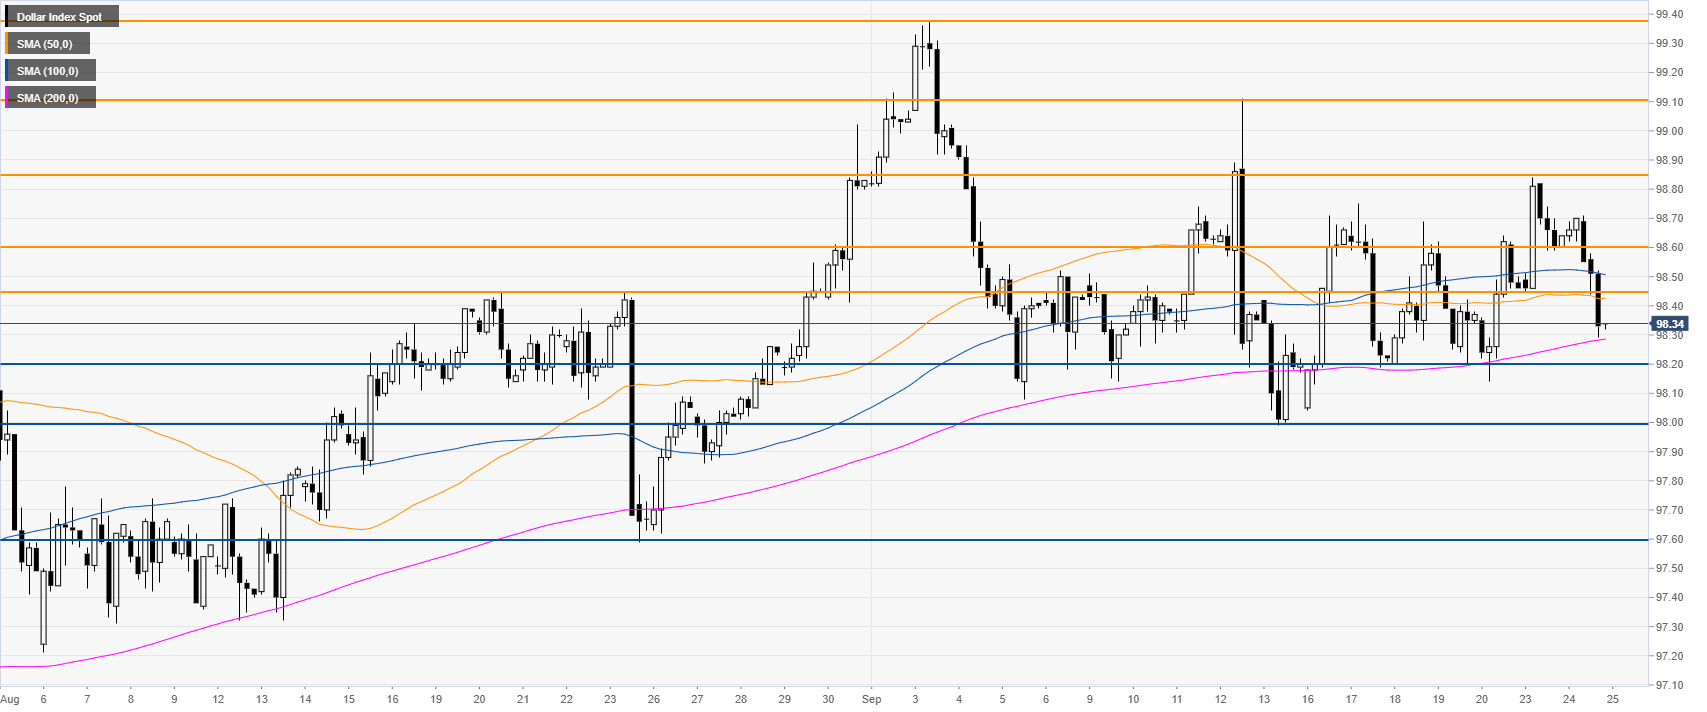
 

DXY four-hour chart

 
DXY has retraced below the 98.45 level and the triangle pattern is no longer into effect. The market is weak with a potential move down to 98.20. A break of this support can expose the 98.00 figure. 
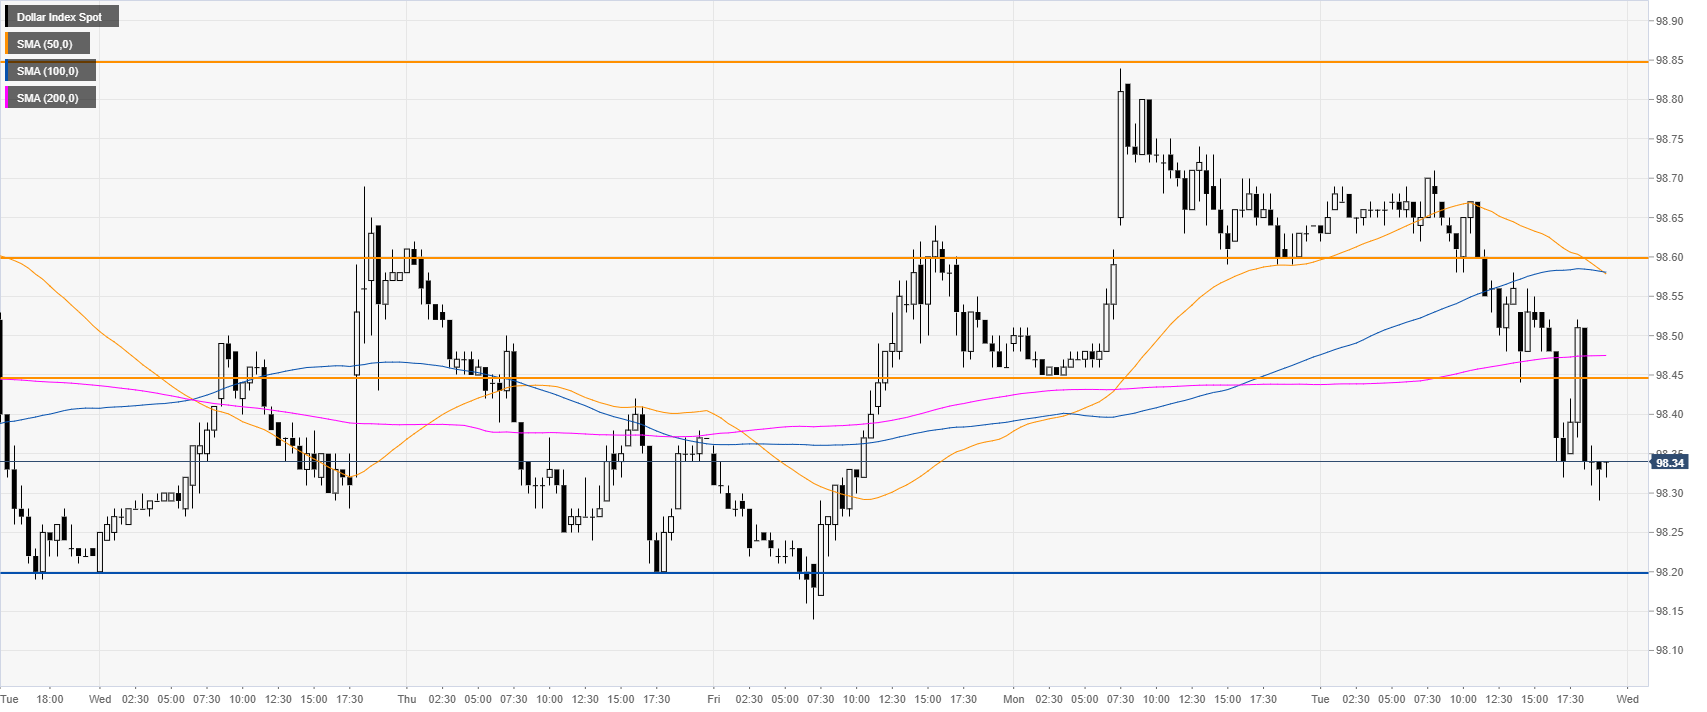
 

DXY 30-minute chart


DXY is trading below the main SMAs, suggesting bearish momentum in the short term. On the way up, resistance is seen at 98.45 and 98.60 price levels.
 

Additional key levels

Dollar Index Spot

Overview
Today last price98.33
Today Daily Change-0.30
Today Daily Change %-0.30
Today daily open98.63
 
Trends
Daily SMA2098.48
Daily SMA5098.08
Daily SMA10097.65
Daily SMA20097.17
 
Levels
Previous Daily High98.84
Previous Daily Low98.45
Previous Weekly High98.75
Previous Weekly Low98.04
Previous Monthly High99.02
Previous Monthly Low97.21
Daily Fibonacci 38.2%98.69
Daily Fibonacci 61.8%98.6
Daily Pivot Point S198.44
Daily Pivot Point S298.25
Daily Pivot Point S398.05
Daily Pivot Point R198.83
Daily Pivot Point R299.03
Daily Pivot Point R399.22

Author

Flavio Tosti

Flavio Tosti

Independent Analyst


More from Flavio Tosti
Share:

Editor's Picks

EUR/USD looks sidelined around 1.1850

EUR/USD remains on the back foot, extending its bearish tone and sliding towards the 1.1850 area to print fresh daily lows on Monday. The move lower comes as the US Dollar gathers modest traction, with thin liquidity and subdued volatility amplifying price swings amid the US market holiday.

GBP/USD flirts with daily lows near 1.3630

GBP/USD has quickly given back Friday’s solid gains, turning lower at the start of the week and drifting back towards the 1.3630 area. The focus now shifts squarely to Tuesday’s UK labour market report, which is likely to keep the quid firmly in the spotlight and could set the tone for Cable’s next move.

Gold loses momentum, eases below $5,000

Gold is giving back part of Friday’s sharp rebound, deflating below the key $5,000 mark per troy ounce as the new week gets underway. Modest gains in the US Dollar are keeping the metal in check, while thin trading conditions, due to the Presidents Day holiday in the US, are adding to the choppy and hesitant tone across markets.

Bitcoin consolidates as on-chain data show mixed signals

Bitcoin price has consolidated between $65,700 and $72,000 over the past nine days, with no clear directional bias. US-listed spot ETFs recorded a $359.91 million weekly outflow, marking the fourth consecutive week of withdrawals.

The week ahead: Key inflation readings and why the AI trade could be overdone

It is likely to be a quiet start to the week, with US markets closed on Monday for Presidents Day. European markets are higher across the board and gold is clinging to the $5,000 level after the tamer than expected CPI report in the US reduced haven flows to precious metals.

XRP steadies in narrow range as fund inflows, futures interest rise

Ripple is trading in a narrow range between $1.45 (immediate support) and $1.50 (resistance) at the time of writing on Monday. The remittance token extended its recovery last week, peaking at $1.67 on Sunday from the weekly open at $1.43.