|

US Dollar Index Price Analysis: Next on the upside comes 96.50

  • DXY regains composure and advances above 96.00.
  • The next target of note is seen at the 96.50 region.

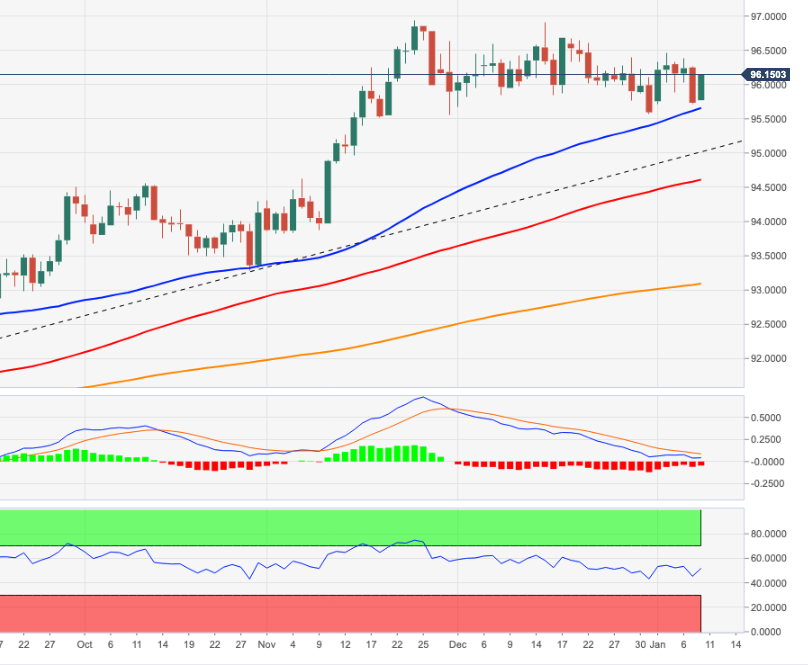
DXY manages to regain the smile and reclaim the 96.00 barrier and above at the beginning of the week.

In case the buying pressure regains conviction, then the next hurdle of relevance should come at the so far YTD high at 96.46 (January 4) ahead of December’s high at 96.90 (December 15).

In the meantime, while above the 4-month support line (off September’s low) around 95.00, further gains in DXY are likely. Looking at the broader picture, the longer-term positive stance remains unchanged above the 200-day SMA at 93.07.

DXY daily chart
Dollar Index Spot

Overview
Today last price96.14
Today Daily Change41
Today Daily Change %0.43
Today daily open95.73
 
Trends
Daily SMA2096.18
Daily SMA5095.79
Daily SMA10094.58
Daily SMA20093.08
 
Levels
Previous Daily High96.26
Previous Daily Low95.71
Previous Weekly High96.46
Previous Weekly Low95.71
Previous Monthly High96.92
Previous Monthly Low95.57
Daily Fibonacci 38.2%95.92
Daily Fibonacci 61.8%96.05
Daily Pivot Point S195.54
Daily Pivot Point S295.35
Daily Pivot Point S394.99
Daily Pivot Point R196.09
Daily Pivot Point R296.45
Daily Pivot Point R396.64

Author

Pablo Piovano

Born and bred in Argentina, Pablo has been carrying on with his passion for FX markets and trading since his first college years.

More from Pablo Piovano

Share:

Editor's Picks

GBP/USD clings to 1.3500 amid marginal losses

GBP/USD alternates gains with losses around the 1.3500 neighbourhood on Tuesday. Indeed, Cable struggles to further extend its incipient recovery in a context of continuous instability in the Middle East and modest gains in the Greenback.

EUR/USD alternates gains with losses near 1.1540

EUR/USD navigates a tight range near 1.1550 in the latter part of Tuesday’s NA session. The US Dollar’s vacillating price action accompanies the pair while market participants gear up for the crucial US inflation data due on Wednesday.

Gold loses the grip below $4,400

Gold retreats from its earlier tops and briefly revisited the $4,350 region per troy ounce on Tuesday. The yellow metal’s modest retracement follows lacklustre gains in the US Dollar and declining US Treasury yields across the curve, all amid steady uncertainty from the geopolitical landscape.

Shiba Inu Price Forecast: SHIB extends sell-off despite surging futures Open Interest
Shiba Inu (SHIB) maintains a bearish outlook on Tuesday, as it edges lower at $0.00000450. This marks the seventh day the meme coin has sustained a sell-off, weighed down by a weak technical structure. Shiba Inu derivatives continue to gain momentum, with perpetual futures Open Interest (OI) rising to 11.08 trillion SHIB on Tuesday, from 10.46 trillion the day before.
The inflation narrative is still way more important than the employment story
Core bonds sold off yesterday with the belly of the curve slightly underperforming in the US while European curves showed more of a bear flattening. Daily changes on the US curve varied between +4.7 bps (2-yr) and +6.4 bps (7-yr).
9-3: Is the Federal Reserve’s vote tally Warsh's new forward guidance?
The rate did not move. Neither did the statement, and that’s the more interesting fact. Set the July 29 Federal Open Market Committee (FOMC) statement beside the one issued on June 17, and the two documents are identical apart from a single verb and a paragraph at the bottom naming three dissenters.
















