|

US Dollar Index Price Analysis: DXY on track to record its largest weekly advance since October 2008

  • DXY is about to end the New York session near its high tick. 
  • Support is seen at the 96.00 and 95.00 figures. 
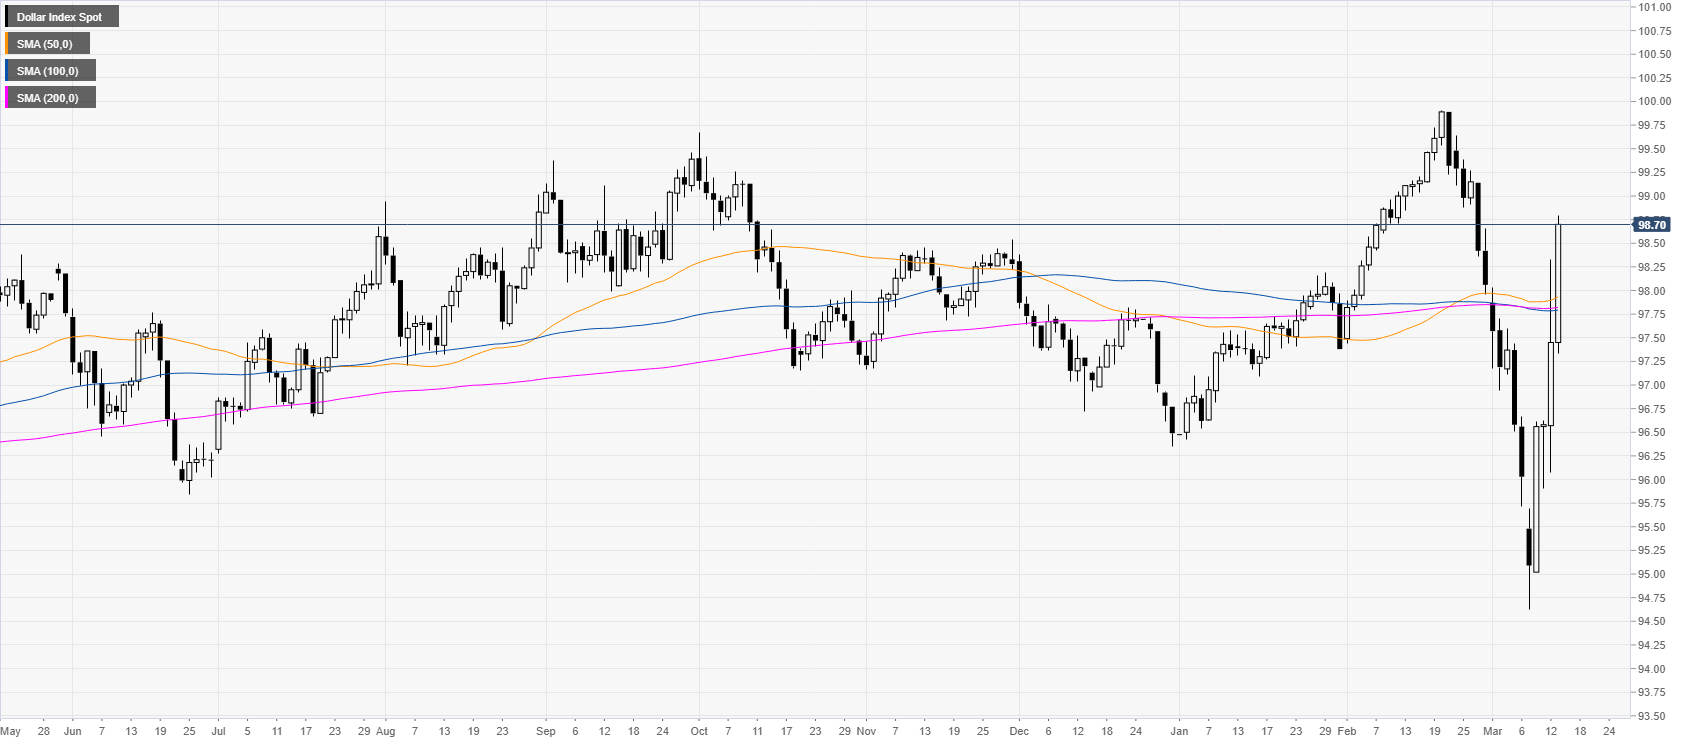
 

DXY daily chart

 
After recording its worst decline in many months DXY (US dollar index) is now on track to register its best weekly gains since October 2008. After one of the worst sessions in history on Thursday, the US stocks are recovering slightly boosting USD across the board. 
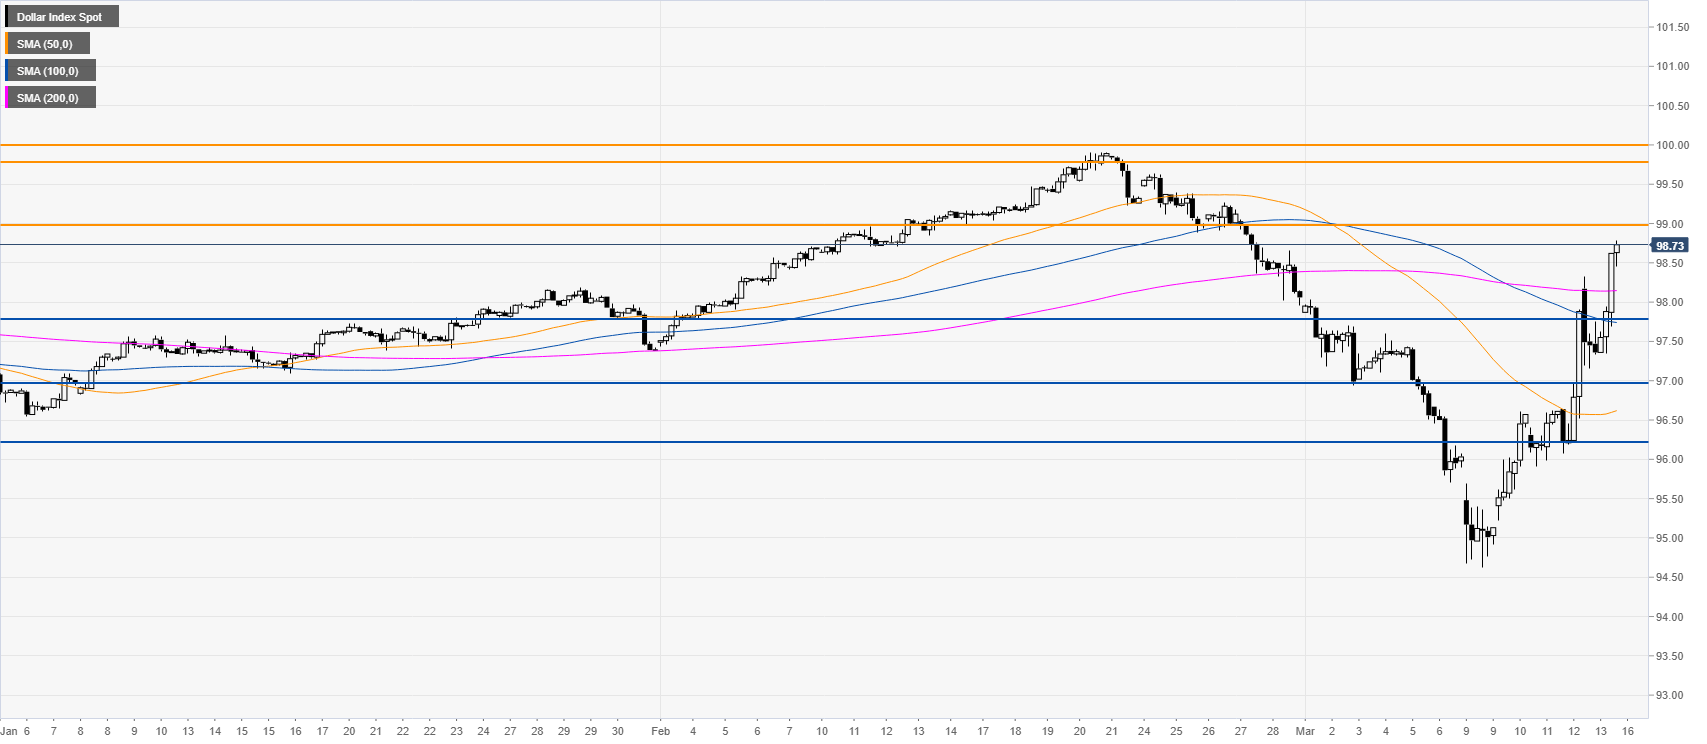


DXY four-hour chart

 
DXY is spiking to the upside while nearing the 99.00 figure while trading above the main SMAs suggesting a bullish bias in the medium term. Given the strength, DXY could reach the 99.75/100.00 resistance zone in the coming sessions. Support is seen near the 97.80 and 97.00 levels.


Additional key levels

Dollar Index Spot

Overview
Today last price98.69
Today Daily Change1.24
Today Daily Change %1.27
Today daily open97.45
 
Trends
Daily SMA2098.04
Daily SMA5097.9
Daily SMA10097.78
Daily SMA20097.81
 
Levels
Previous Daily High98.33
Previous Daily Low96.07
Previous Weekly High98.03
Previous Weekly Low95.71
Previous Monthly High99.91
Previous Monthly Low97.44
Daily Fibonacci 38.2%97.47
Daily Fibonacci 61.8%96.93
Daily Pivot Point S196.24
Daily Pivot Point S295.02
Daily Pivot Point S393.98
Daily Pivot Point R198.5
Daily Pivot Point R299.54
Daily Pivot Point R3100.76

Author

Flavio Tosti

Flavio Tosti

Independent Analyst


More from Flavio Tosti
Share:

Markets move fast. We move first.

Orange Juice Newsletter brings you expert driven insights - not headlines. Every day on your inbox.

By subscribing you agree to our Terms and conditions.

Editor's Picks

EUR/USD trims losses and returns to the 1.1750 area

The US Dollar resumed its decline in the American afternoon, helping EUR/USD trim early losses. The pair trades around 1.1750 as market participants gear up for the European Central Bank monetary policy decision and the United States Consumer Price Index.

GBP/USD flirts with 1.3400 after nearing 1.3300

The GBP/USD changed course after dipping with UK inflation data, and trades near the 1.3400 mark, as investors expect the Bank of England to deliver a 25 basis points interest rate cut after the two-day meeting on Thursday.

Gold flirts with weekly range hurdle; looks to US CPI for fresh impetus

Gold is seen consolidating near the top end of the weekly range, below the $4,350 level, during the Asian session on Thursday. The US Dollar preserves the overnight recovery gains and caps the bullion, though a weaker risk tone and dovish Fed bets act as a tailwind for the non-yielding yellow metal. Traders now look to the US consumer inflation figures for cues about the Fed's rate-cut path in 2026 before placing fresh directional bets around the XAU/USD pair.

Bitcoin risks deeper correction as ETF outflows mount, derivative traders stay on the sidelines

Bitcoin (BTC) remains under pressure, trading below $87,000 on Wednesday, nearing a key support level. A decisive daily close below this zone could open the door to a deeper correction.

Monetary policy: Three central banks, three decisions, the same caution

While the Fed eased its monetary policy on 10 December for the third consecutive FOMC meeting, without making any guarantees about future action, the BoE, the ECB and the BoJ are holding their respective meetings this week. 

Crypto Today: Bitcoin, Ethereum, XRP slide further as risk-off sentiment deepens

Bitcoin faces extended pressure as institutional investors reduce their risk exposure. Ethereum’s upside capped at $3,000, weighed down by ETF outflows and bearish signals. XRP slides toward November’s support at $1.82 despite mild ETF inflows.