|

URW Elliott Wave technical forecast [Video]

URW Elliott Wave technical analysis

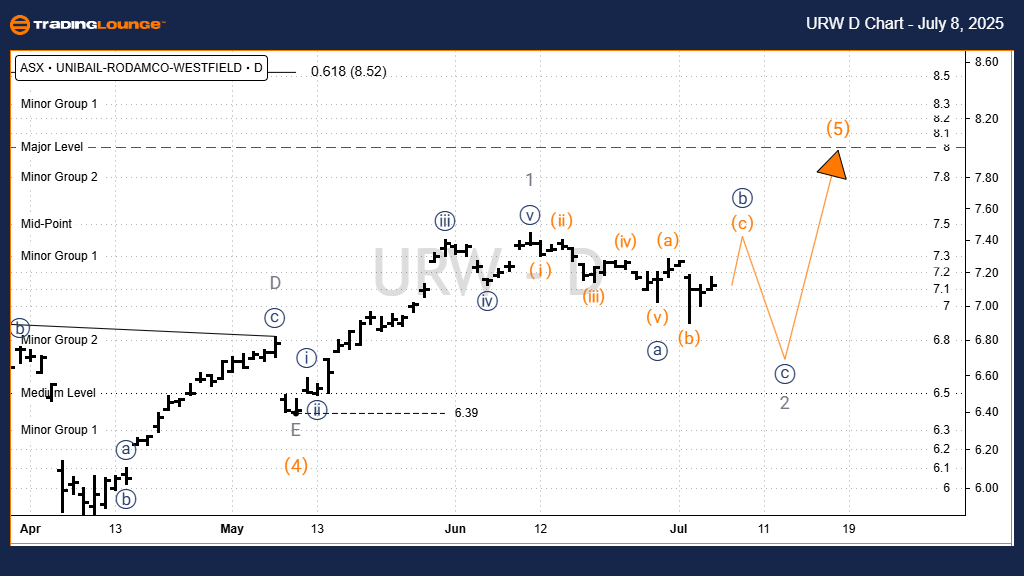
Greetings, our Elliott Wave analysis today updates the Australian Stock Exchange (ASX) with UNIBAIL‑RODAMCO‑WESTFIELD – URW. We see that URW stock has potential to increase in the medium term with a fifth wave. However, in the short term, it is not yet a reasonable buying point. This analysis will clearly show that.

Function: Major trend (Minor degree, grey).

Mode: Motive.

Structure: Impulse.

Position: Wave 2‑grey of Wave 5‑orange.

Details:

Wave 4‑orange ended at a low of 6.39 as a triangle labeled A,B,C,D,E‑grey. Now, wave 5‑orange is moving higher, targeting the next high around 8.52. I don’t think wave 5‑orange is finished, so it’s likely to continue moving higher.

Invalidation point: 6.39.
Chart

URW Elliott Wave technical analysis

Function: Major trend (Minor degree, grey).

Mode: Motive.

Structure: Impulse.

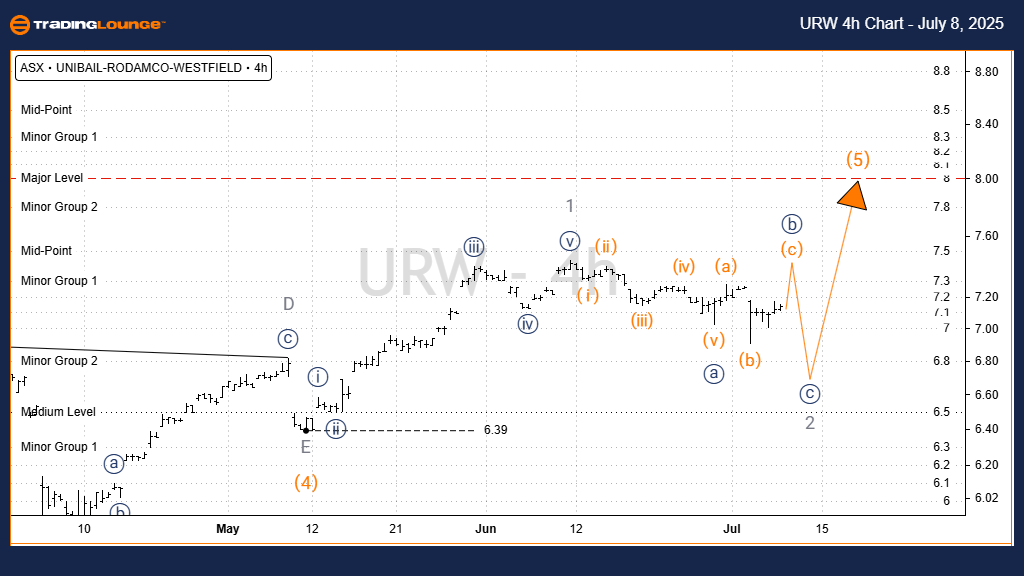
Position: Wave c‑orange of Wave b‑navy of Wave 2‑grey.

Details:

On a closer look, wave 1‑grey has completed as a five-wave, and wave 2‑grey is unfolding downward as a zigzag labeled a‑b‑c‑navy. I see that we’re moving higher with wave B‑navy as an expanded flat, and then likely to have another push lower with wave c‑navy.

Invalidation point: 6.39.
Chart

Conclusion

Our analysis, forecast of contextual trends, and short-term outlook for ASX: UNIBAIL‑RODAMCO‑WESTFIELD – URW aim to provide readers with insights into current market trends and how to capitalize on them effectively. We offer specific price points that act as validation or invalidation signals for our wave count, enhancing confidence in our perspective. By combining these factors, we strive to offer readers the most objective and professional perspective on market trends.

URW Elliott Wave technical analysis [Video]

Author

Peter Mathers

Peter Mathers

TradingLounge

Peter Mathers started actively trading in 1982. He began his career at Hoei and Shoin, a Japanese futures trading company.


More from Peter Mathers
Share:

Editor's Picks

AUD/USD sits near a one-month top, above 0.7000 amid fresh USD selling

AUD/USD holds above 0.7000 through the Asian session, trading near a one-month high touched earlier this Monday amid renewed US Dollar selling. US bond yields decline further amid a modest pullback in crude oil prices, capping the USD recovery from a three-week low. Moreover, bets for a November RBA rate hike support the Aussie, though upside seems capped ahead of the crucial two-day FOMC meeting, starting Tuesday.

USD/JPY struggles below 157.00 on weak USD; holds above one-month low ahead of Fed, BoJ meetings

USD/JPY attracts fresh sellers during the Asian session on Monday, stalling its recovery from the lowest level since September 18, touched Friday as a further decline in US bond yields weighs on the US Dollar. Meanwhile, the Japanese Yen benefits from a more hawkish BoJ, further weighing on the currency pair. The downside, however, seems limited as traders keenly await Fed and BoJ policy meetings later this week.

Gold gains at start of Fed’s policy week

Gold finds bids below $4,000 in the Asian trade on Monday. The precious metal starts the Federal Reserve’s monetary policy week on positive note, but is broadly vulnerable, being closer to its three-month low of $3,975.


Bitcoin slides below $80,000, Ethereum and XRP bears in control
Bitcoin (BTC), Ethereum (ETH) and Ripple (XRP) bears remain in control, extending losses on Monday after three straight weeks of declines. BTC slips below $80,000, while ETH and XRP follow BTC’s lead and trade lower at $2,315 and $1.30, respectively. The price action of these top three cryptocurrencies suggests weakening momentum indicators, raising the risk of a deeper correction.
CFTC Report: WTI rally runs ahead of positioning
The week in one sentence: WTI prices surged while speculative longs were cut in the week to October 20, creating the clearest price/positioning divergence. Sterling and the Canadian Dollar led the constructive currency shift, while Yen longs also rebuilt. Speculators turned less constructive on the WTI, reducing their net exposure to around 89.3K contracts.
What November 3 means for the Fed's rate path and the US Dollar

The USD faces a decisive period ahead of the November 3 midterm elections. While markets anticipate another interest rate increase from the Fed in December, the battle for control of Congress could reshape fiscal policy expectations and, indirectly, the path of US monetary policy in 2027.