$UHRN: Swatch Group provides an entry area for a next rally

Swatch Group is a Swiss manufacturer of watches and jewellery. Besides the product line Swatch, the group owns brands including Blancpain, Breguet, ETA, Glashütte, Omega, Longines, Tissot, Hamilton, Certina, Rado and Harry Winston. As a matter of fact, the Swatch company employs about 36000 people in over 50 countries. Founded 1983 and headquartered in Biel/Bienne, Switzerland, it can be traded under tickers $UHRN and $UHR at Six Swiss Exchange. After printing the all-time highs in April 2014, the stock price has lost about 3/4 of the price by March 2020. Currently, we see Swatch starting a new larger cycle higher.
In the initial article from March 2021, we have called for a new cycle up. We were right. Now, we see a pullback reseting part of the rise from March 2020 lows. In the current blog we analyze the consolidation pattern and provide a buying area for medium- and long-term investors.
Swatch monthly Elliott Wave analysis 05.15.2022
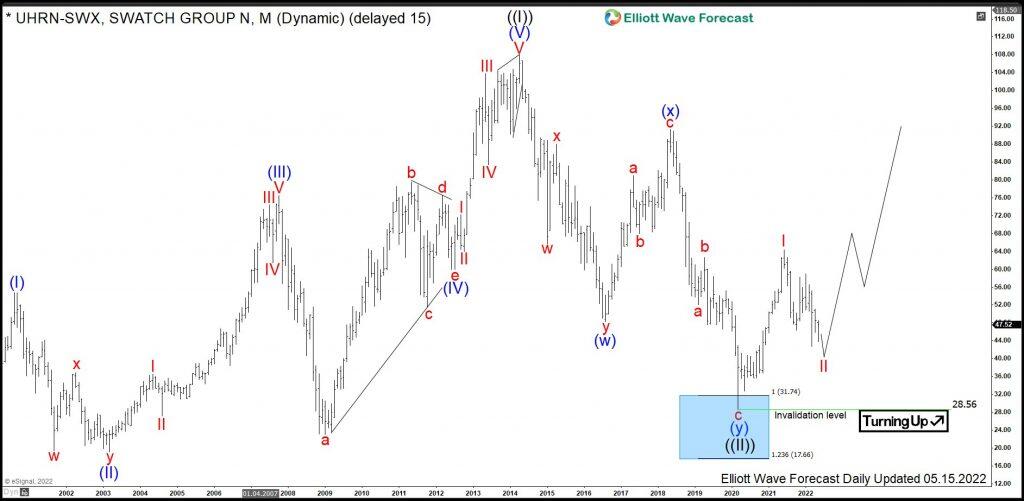
The monthly chart below shows the Swatch stock $UHRN traded at Six Swiss. From the all-time lows, the stock price has developed a cycle higher in wave ((I)) of a grand super cycle degree. Swatch has printed the all-time highs in April 2014 at 108.00. Without any doubt, the advance is a textbook quality impulsive move up in 5 waves. Also, the subdivisions are motive waves, too. From April 2014 highs, a correction lower in wave ((II)) has unfolded as a double three pattern being 3-3-3 structure. It has reached the equal legs extension area towards 31.74-17.66. From that area, a strong reaction higher can be seen. Hereby, Swatch might be in the first stages of a new cycle in black wave ((III)) higher. While above 28.56, Swatch should extend towards the new all-time highs targeting the 135.96-202.34 area and even higher.
Swatch daily Elliott Wave analysis 05.15.2022
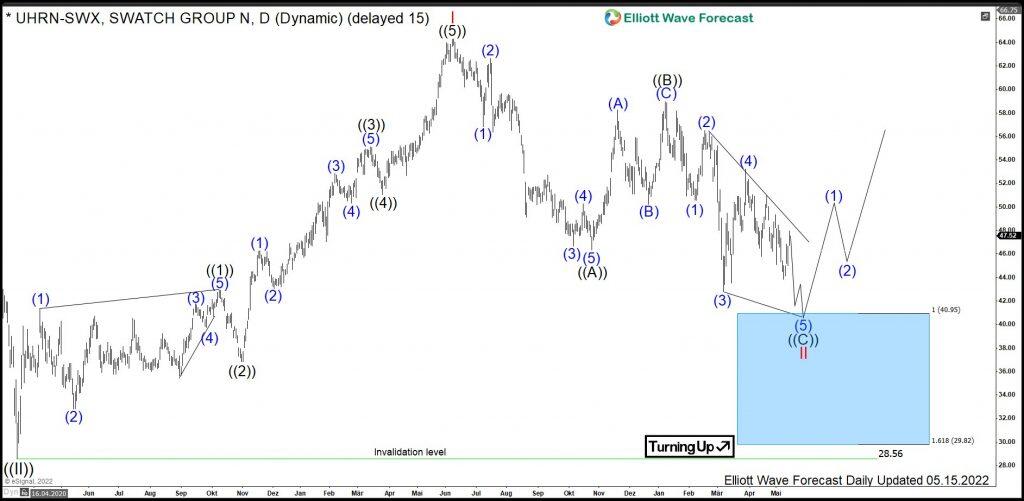
The daily chart below shows the intial nest consisting of red waves I-II of blue wave (I). From the March 2020 lows, red wave I has developed an impuls higher. It has ended in June 2021 at 64.30. From there, a pullback in wave II is unfolding as an Elliott wave zigzag pattern. First, wave ((A)) has ended in October 2021 at 46.32. Then, a connector in wave ((B)) has printed a lower high at 58.95. From there, wave ((C)) is in progress and may develop an ending diagonal structure. Investors and traders can be looking to buy $UHRN from 40.95-29.82 area. There, a rally in wave III should take place or a bounce in 3 waves as minimum. The target for wave III will be 64.30 highs and even beyond.
Author

Elliott Wave Forecast Team
ElliottWave-Forecast.com