The Watchlist: GBP/JPY, EUR/USD, CHF/JPY and more setups in the making

The watchlist for the week ahead consists of a couple of compelling day trading opportunities for the open as well as plenty of action down the line following the higher volatility and sharp moves of last week.
We have GBP/JPY, and GBP/CHF (correlated pairs) for which are priorities of the list for the open, while swing trading opportunities are located in EUR/USD, AUD/USD, CHF/JPY, GBP/CHF, GBP/AUD and EUR/AUD.
GBP/JPY hourly chart
-637501538292033620.png)
The price made a higher high only to pull back to test old resistance turned support. Bulls could well re-engage at this juncture.
A -61.8% Fibonacci measurement of correction offers 149.40 as an upside target.
15-min chart
-637501537408579296.png)
Conditions on the 15-min chart are mixed with MACD in positive territory while the price is below the 21 moving average and resistance. If price moves higher in the open and breaks resistance, there are high probabilities of a higher-high for the sessions ahead, as there are for GBP/CHF:
GBP/CHF hourly chart
-637501404601847589.png)
15-min chart
-637501406559776323.png)
EUR/USD daily chart
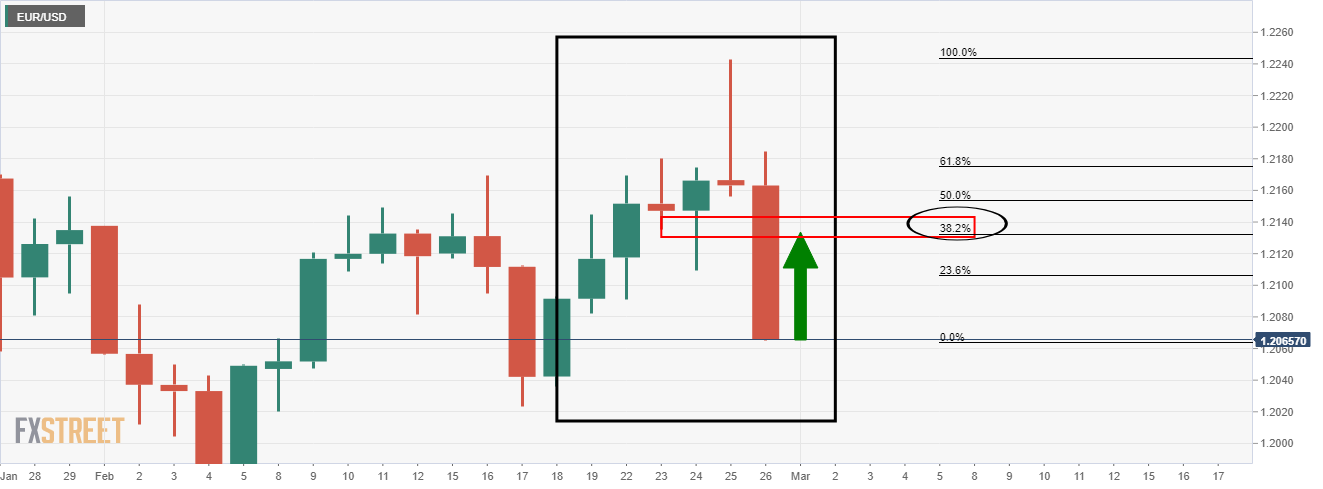
The M-formation is a bullish pattern where the price would be expected to revert back to test the neckline and prior support, or, to at least the 38.2% Fibonacci level.
EUR/USD hourly chart
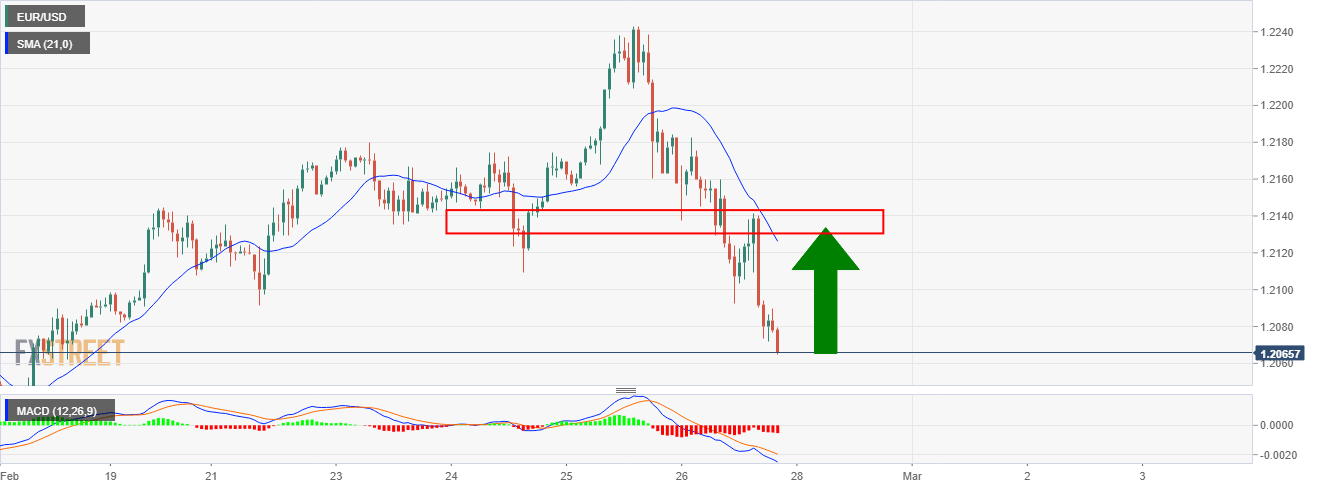
There is some work to do yet while the price is below the 21-moving average. However, a period of consolidation and a gradual grind to the upside would be expected to draw in the MA and offer more favourably bullish technical conditions.
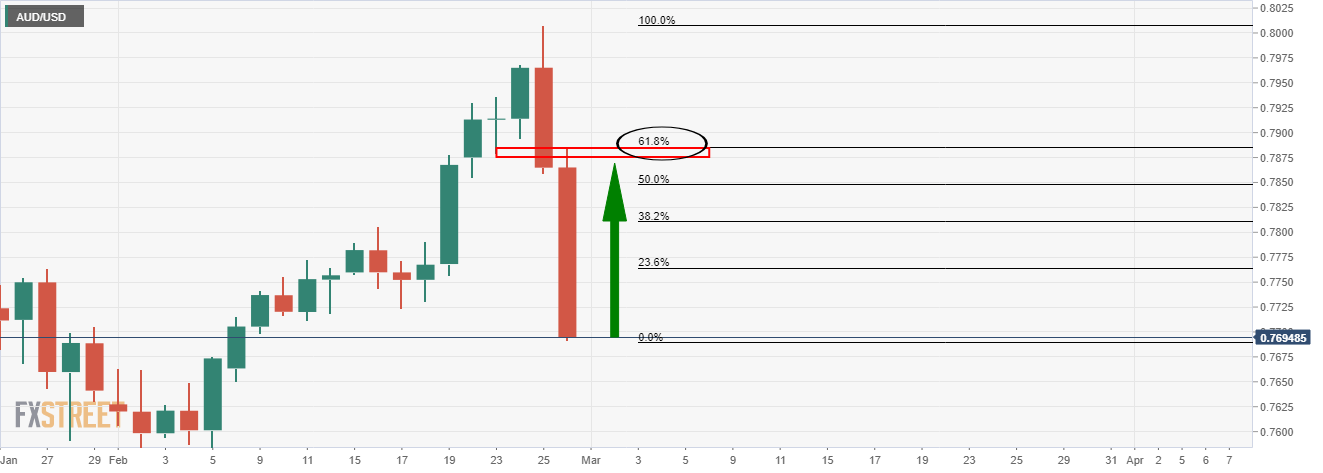
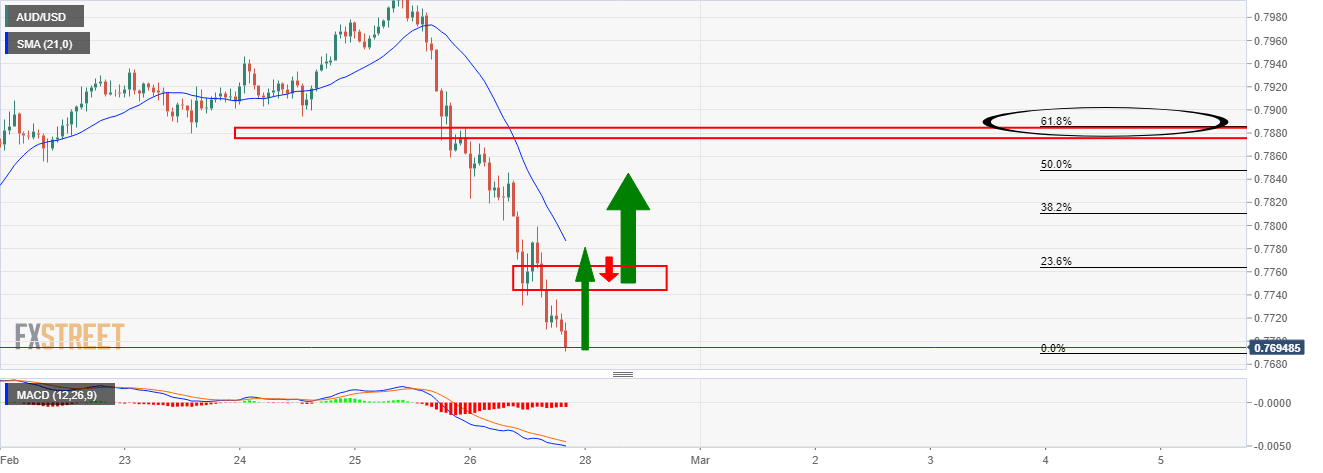
We have a similar situation in AUD/USD:
CHF/JPY daily chart
-637501423490471187.png)
The price has been rejected at the neckline of the M-formation and would be now expected to deteriorate in a fresh daily impulse to the downside.
4-hour chart
-637501426628161145.png)
In clearing support, the price would be expected to restest the structure and the commitments of the bears at the 21-moving average.
EUR/AUD, daily chart
-637501430246291187.png)
With the price meeting resistance, there is a high probability that the bears will retest the bull's commitments at old resistance which has a confluence with the 62% Fibonacci retracement.
The hourly chart can be monitored for bearish technical conditions
-637501433894280344.png)
AUD/CAD daily chart
-637501435884807384.png)
1-hour chart
-637501438160021862.png)
The price action will determine bullish conditions on a break of the current resistance from which bulls can begin to look for a bullish structure to form for an optimal entry point to target old support and the neckline of the M-formation.
The reverse can be said of GBP/AUD:
GBP/AUD daily chart
-637501442707646422.png)
GBP/AUD hourly chart
-637501444093480513.png)
Author

Ross J Burland
FXStreet
Ross J Burland, born in England, UK, is a sportsman at heart. He played Rugby and Judo for his county, Kent and the South East of England Rugby team.


