The VIX remains elevated in historical terms but there could be more downise to come


  • The CBOE Volatility Index (VIX) is 7.57% lower as stock markets start the week off higher.
  • In terms of "normal levels" the index is far from its usual range.
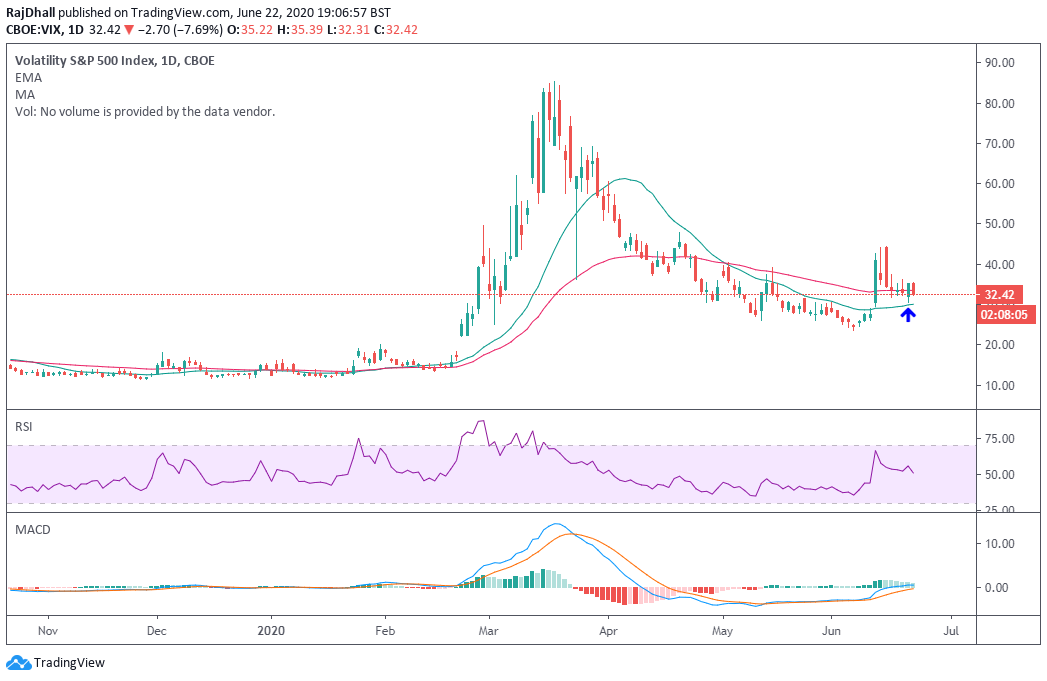
VIX daily chart

The VIX is usually there to measure volatility and is calculated using a formula to derive expected volatility by averaging the weighted prices of out-of-the-money puts and calls. These are bearish (Puts) and Bullish (Calls) options based on the S&P 500.

On Monday you can see from the chart below that the index has fallen by over 7%. This usually happens when the stock markets rally and the risk appetite in the market is positive. 

The price is currently trading above the 55 Exponential Moving Average and 200 Simple Moving Average. The moving averages are a good gauge in the VIX as when the price is underneath it usually represents a bull market. In this case, the VIX has used the 200 Simple Moving Average as a support zone and bounced back to the upside. In the future this support could be broken.

The US administration has recently indicated that even if there is a second wave of the COVID-19 pandemic, there will not be another lockdown or period of store closures. This could be bearish for the VIX and during the week if not next week the price may move back below the moving averages. There also seems to be another round of fiscal stimulus on the way, in which US residents could receive another cheque.

If the stock markets continue to trend higher then the VIX could eventually return to more normal levels between 11 and 20. At the moment the price is around 32 and in March was close to hitting 85.50 a far cry from where the market landscape is today.

VIX Stock Market Volatility

Share: Feed news

All information and content on this website, from this website or from FX daily ltd. should be viewed as educational only. Although the author, FX daily ltd. and its contributors believe the information and contents to be accurate, we neither guarantee their accuracy nor assume any liability for errors. The concepts and methods introduced should be used to stimulate intelligent trading decisions. Any mention of profits should be considered hypothetical and may not reflect slippage, liquidity and fees in live trading. Unless otherwise stated, all illustrations are made with the benefit of hindsight. There is risk of loss as well as profit in trading. It should not be presumed that the methods presented on this website or from material obtained from this website in any manner will be profitable or that they will not result in losses. Past performance is not a guarantee of future results. It is the responsibility of each trader to determine their own financial suitability. FX daily ltd. cannot be held responsible for any direct or indirect loss incurred by applying any of the information obtained here. Futures, forex, equities and options trading contains substantial risk, is not for every trader, and only risk capital should be used. Any form of trading, including forex, options, hedging and spreads, contains risk. Past performance is not indicative of future FX daily ltd. are not Registered Financial Investment Advisors, securities brokers-dealers or brokers of the U.S. Securities and Exchange Commission or with any state securities regulatory authority OR UK FCA. We recommend consulting with a registered investment advisor, broker-dealer, and/or financial advisor. If you choose to invest, with or without seeking advice, then any consequences resulting from your investments are your sole responsibility FX daily ltd. does not assume responsibility for any profits or losses in any stocks, options, futures or trading strategy mentioned on the website, newsletter, online trading room or trading classes. All information should be taken as educational purposes only.

Recommended content


Recommended content

Editors’ Picks

AUD/USD: Extra gains in the pipeline above 0.6520

AUD/USD: Extra gains in the pipeline above 0.6520

AUD/USD partially reversed Tuesday’s strong pullback and regained the 0.6500 barrier and beyond in response to the sharp post-FOMC pullback in the Greenback on Wednesday.

AUD/USD News

EUR/USD jitters post-Fed with NFP Friday over the horizon

EUR/USD jitters post-Fed with NFP Friday over the horizon

EUR/USD cycled familiar territory on Wednesday after the US Federal Reserve held rates as many investors had expected. However, market participants were hoping for further signs of impending rate cuts from the US central bank.

EUR/USD News

Gold prices skyrocketed as Powell’s words boosted the yellow metal

Gold prices skyrocketed as Powell’s words boosted the yellow metal

Gold prices rallied sharply above the $2,300 milestone on Wednesday after the Federal Reserve kept rates unchanged while announcing that it would diminish the pace of the balance sheet reduction. 

Gold News

Ethereum plunges outside key range briefly as US Dollar Index gains strength

Ethereum plunges outside key range briefly as US Dollar Index gains strength

Institutional whales appear to be dumping Ethereum after recent dip. Fed’s decision to leave rates unchanged appears to have helped ETH's price recover slightly. SEC Chair Gensler has misled Congress, considering recent revelations from Consensys suit, says Congressman McHenry.

Read more

The FOMC whipsaw and more Yen intervention in focus

The FOMC whipsaw and more Yen intervention in focus

Market participants clung to every word uttered by Chair Powell as risk assets whipped around in a frenetic fashion during the afternoon US trading session.

Read more

Forex MAJORS

Cryptocurrencies

Signatures