|

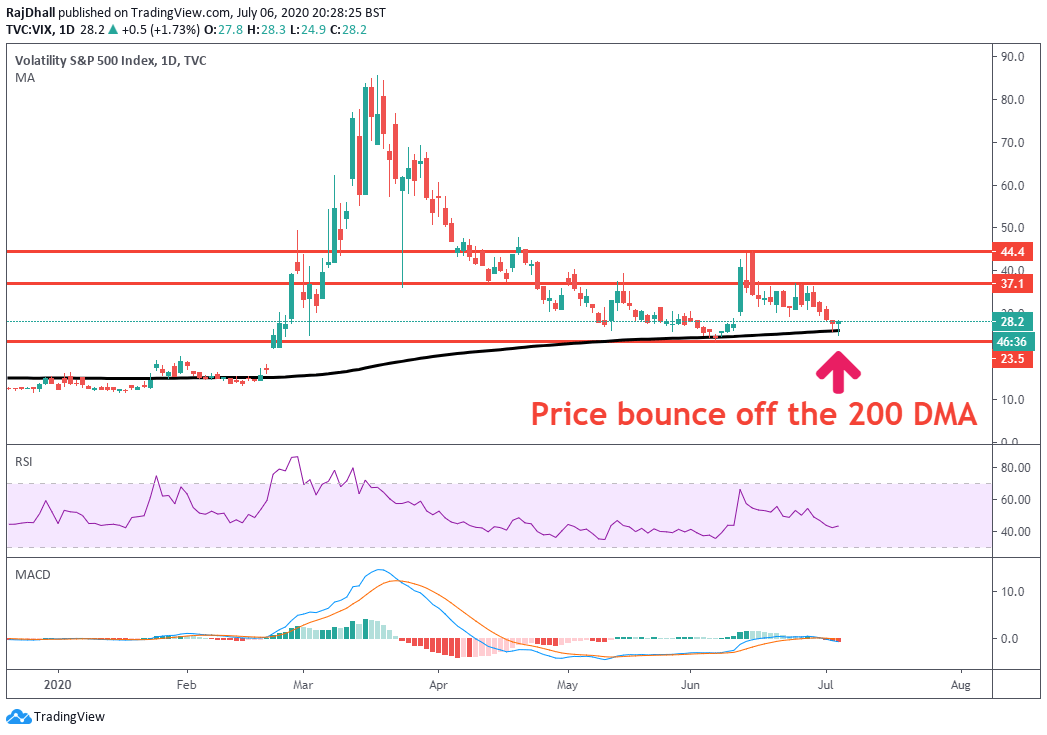
The VIX has met some support at the 200 Daily Simple Moving Average

  • The VIX is slightly higher on the session even as equities jump on Monday.
  • The price has bounced off a key support area as equities stall at higher levels.

Fundamental backdrop

Equities have bounced higher after the Independence day break on Friday and over the weekend. Once again the markets are choosing to look at the positives rather than the rising number of coronavirus cases in the US. Today's US ISM non-manufacturing purchasing managers’ index (PMI) pushed higher to 57.1 in June from 45.4 in May. Once again the tech sector is outperforming and industry bellwether Amazon topped the $3K mark for the first time. 

In terms of the S&P 500, Freeport McMoran is the top performer rising around 10.17% on Monday. The company may need to shift its tactics due to the COVID-19 pandemic. They also stated the new operations come as the company says that it expects to see higher copper and gold production in the second quarter. The bottom of the leaderboard is dominated by energy firms as travel restrictions remain in place in the US. 

VIX daily chart

The chart below shows the VIX price bouncing off the 200 day Simple Moving Average to great effect. The VIX price had been heading lower at the start of the session as the risk sentiment seemed to be positive. The key level in the index remains at 23.5 and a break to the downside could mean a return to more "normal" levels. 

The Relative Strength Index is holding below the 50 area which means we could still see a fall. The MACD is also looking depressed as it is in the red and the signal lines are still below the zero line.

VIX technical chart

Author

Rajan Dhall, MSTA

Rajan Dhall is an experienced market analyst, who has been trading professionally since 2007 managing various funds producing exceptional returns.

More from Rajan Dhall, MSTA
Share:

Editor's Picks

EUR/USD meets initial support around 1.1800

EUR/USD remains on the back foot, although it has managed to reverse the initial strong pullback toward the 1.1800 region and regain some balance, hovering around the 1.1850 zone as the NA session draws to a close on Tuesday. Moving forward, market participants will now shift their attention to the release of the FOMC Minutes and US hard data on Wednesday.
 

GBP/USD bounces off lows, retargets 1.3550

After bottoming out just below the 1.3500 yardstick, GBP/USD now gathers some fresh bids and advances to the 1.3530-1.3540 band in the latter part of Tuesday’s session. Cable’s recovery comes as the Greenback surrenders part of its advance, although it keeps the bullish bias well in place for the day.

Gold remains offered below $5,000

Gold stays on the defensive on Tuesday, receding to the sub-$5,000 region per troy ounce on the back of the persistent move higher in the Greenback. The precious metal’s decline is also underpinned by the modest uptick in US Treasury yields across the spectrum.

Ethereum Price Forecast: BitMine extends ETH buying streak, says long-term outlook remains positive

Ethereum (ETH) treasury firm BitMine Immersion continued its weekly purchase of the top altcoin last week after acquiring 45,759 ETH.

UK jobs market weakens, bolstering rate cut hopes

In the UK, the latest jobs report made for difficult reading. Nonetheless, this represents yet another reminder for the Bank of England that they need to act swiftly given the collapse in inflation expected over the coming months. 

Ripple slides to $1.45 as downside risks surge

Ripple edges lower at the time of writing on Tuesday, from the daily open of $1.48, as headwinds persist across the crypto market. A short-term support is emerging at $1.45, but a buildup of bearish positions could further weaken the derivatives market and prolong the correction.