The ES is range trading and bonds are likely in the accumulation phase

This is starting to feel a lot like 2011.
The current market environment is unprecedented, for all the obvious reasons. We've never shut down and reopened the global economy, nor has the government been this aggressive in its quest to support economic activity. Nevertheless, we are seeing similarities in both stocks and commodities that remind us of the years following the financial crisis. This makes sense because COVID rekindled the same monetary policies deployed in 2009, only bigger.
In 2011, the equity markets suffered a correction from the rally that began in March of 2009. The correction started in February of 2011, worsened during the summer, and eventually concluded in October of the same year. Similarly, two years after the March 2020 low the stock market is digesting the government stimulus rally. However, because the economy received a much bigger artificial jolt in the aftermath of Covid than it did in the financial crisis, the volatility on both sides is larger and the stakes are higher.
In any case, the good news for long-term investors is that 2011 was a tough year, but it was eventually followed by lower volatility and firm pricing. The bad news is, that we could be in store for a choppy summer and early fall.
The economy probably isn't as healthy as it appears to be on the surface. For instance, the jobs market is extremely tight but the massive number of job openings and the lack of workers to fill them seems to signal that something is broken, not something that is booming. To elaborate, those attempting to travel, eat out, or otherwise participate in entertainment activities have likely discovered life isn't what it was in 2019. Prices are high and service is down. I suspect this will continuously discourage consumers from spending money on services, and likely even goods. Further, recessions are sometimes self-inflicted due to the altered behavior of spenders and we seem to be headed down that path.
Treasury Futures Markets
30-year Treasury Bond Futures
Financial media has focused on the spreads between Treasuries and corporate bonds, but the spread doesn't tell the whole story.
The spread between " default-risk-free" fixed-income assets and corporate debt is a factor analysts look at to determine if there is systematic stress or fear. Currently, the spread between these two assets has portrayed economic stability, but we aren't convinced it is a reliable indicator in today's environment. This is because economic turmoil generally triggers buying in Treasuries (flight to safety) and the selling of corporate debt (investors liquidating riskier assets). Yet, the sharpest inflation in forty years has caused Treasuries to uncharacteristically sell off along with corporate bonds; in our view, this isn't a sign of stability it is a sign of instability. If that assumption is correct, investors might finally begin allocating some funds to safety assets.
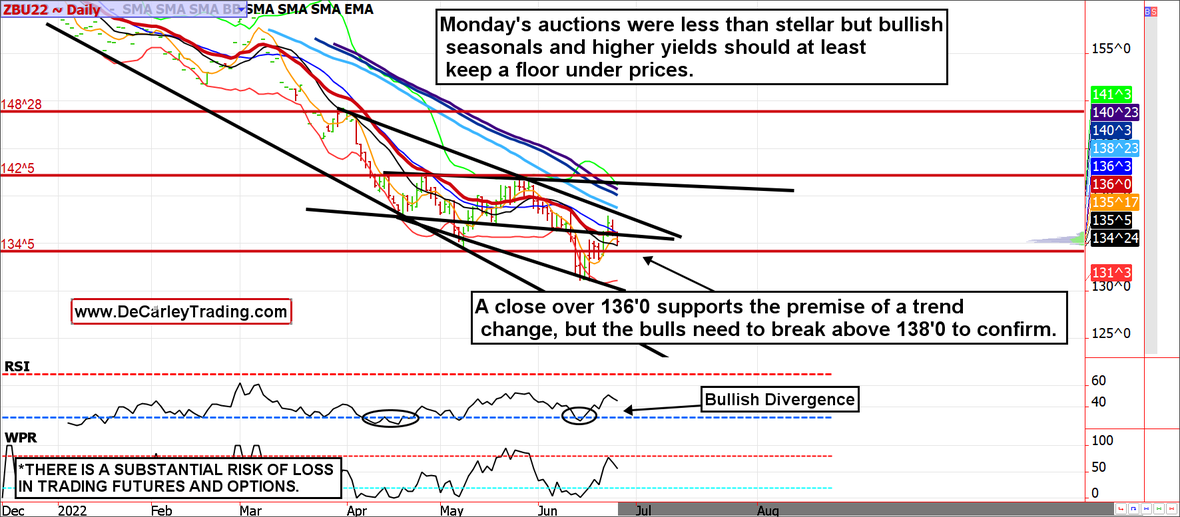
On a side note, as murky as the fundamentals are due to simultaneous inflation and recession fears, there is no question about which direction seasonal tendencies are pointing...higher bonds and lower yields. The September 10-year note generally moves higher from mid-June through early-September.
Treasury futures market consensus:
A close over 136'0 in the September 30-year is needed to keep the bulls in the game. A break above 138'0 confirms a trend change.
Technical Support: 134'05, 131'07, and 130'04 ZN: 116'20, 115'20, 114'07, and 113'19
Technical Resistance: ZB: 138'01, 142'05, and 148'28 ZN: 118'08, 120'22 and 122'31
Stock Index Futures
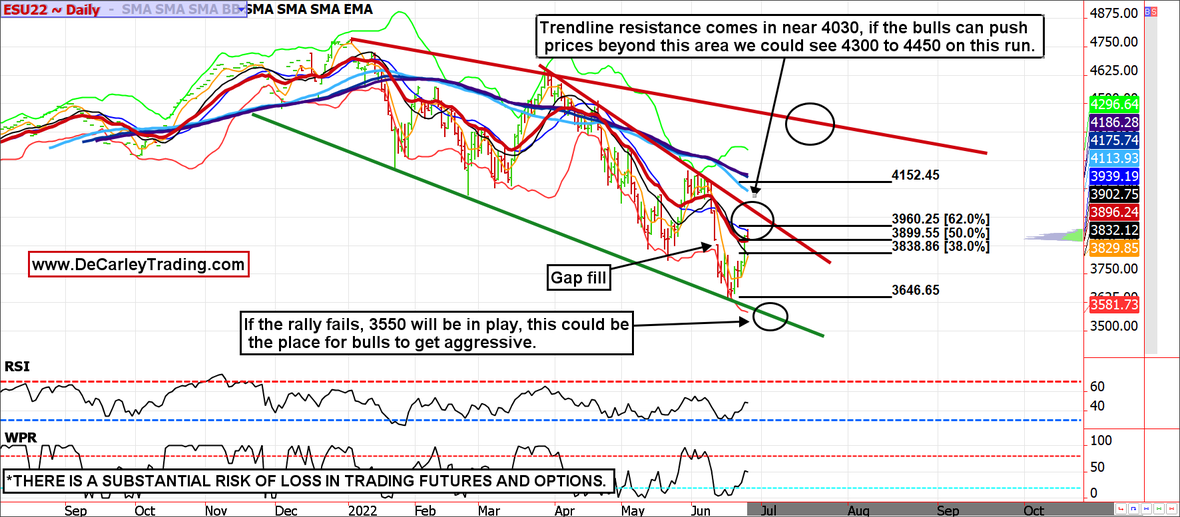
The Trendline says 4030 will likely be seen, but the bears are still in charge.
Stock market bear markets are difficult to manage. Unlike uptrends, downtrends are violent. New lows are accompanied by massive bear market bounces capable of making the bears question their existence. While we are optimists at heart and we recognize bullish seasonal tendencies in the coming weeks, the chart suggests the uptrend will struggle to break 4030 (assuming it is seen). Further, our longer-term chart work is still calling for a high likelihood of a 3550ish print, but if seen that could be the place for bulls to get aggressive.
Stock index futures market consensus:
A break above 4030 could see a run to 4300 or 4450, but the most likely scenario is a failed rally that brings the index toward 3550.
Technical Support: 3830, 3650, and 3550
Technical Resistance: 3960, 4030, 4200, 4320, and 4450
E-mini S&P Futures Swing/Day Trading Levels
These are counter-trend entry ideas, the more distant the level the more reliable but the less likely it is to get filled
ES Day Trade Sell Levels: 3960 (minor), 4030, 4290, 4450, and 4560
ES Day Trade Buy Levels: 3850 (minor), 3810, 3650 and 3550
In other commodity futures and options markets...
October 20 - Buy December 2022 (not 21) $7.00 corn calls near 12 cents.
April 20 - Bear put spread with naked call in November soybeans (Buy November $15 put, sell November $14 put, and sell the $18 call).
April 21 - Buy March 2023 eurodollar 98 calls near 12 points ($300).
April 21 - Bull call spread with a naked leg in August gold (buy the $1975 call, sell the $2075 call and sell the $1850 put).
April 22 - Bull call spread with a naked leg in July Silver (Buy the $25 call, sell the $26.50 call, and sell the $22 put).
May 3 - Bear put spread in September corn with a naked call (buy September 7.40 put, sell the 6.60 put and sell a 9.00 call).
May 3 - Bear put spread in September oil with a naked leg (buy September oil 95 put, sell the 85 put and sell the 120 call).
May 9 - Buy August live cattle 140 calls
May 18 - Buy September wheat 12.00 put, sell 11.00 put and sell a 15.00 call.
May 24 - Bear put spread with a naked short call in September nat gas (buy the September $8.00 put, sell the $7.00 put and sell the $13.00 call for a credit of about $1200 to $1500).
May 27 - Bull call spread with a naked leg in September wheat (buy the $12 call, sell the $13 call, and sell the $10 put).
June 2 - Buy July coffee 2.30 puts.
June 7 - Buy September bond 139 call, sell the 143 call, and sell the 132 put for roughly even money.
June 8 - Buy July Sugar 19.25 calls for about 20 ticks.
June 16 - August crude oil put butterfly, buy August $105 put, sell 2 $100 puts, and buy $95 put for about 55 cents.
June 16 - Buy August silver 22.50 call, sell the 23.50 call and the 19.50 put for a net premium of about 10.5 cents.
June 23 - Buy September natural gas $6.50 call, sell the $7.50 call and sell the $5.50 put for a net cost of about $150.
June 24 - Buy September corn $7.00/$7.75 call spread for about 19 cents.
Due to time constraints and our fiduciary duty to put clients first, the charts provided in this newsletter may not reflect the current session data.
Seasonality is already factored into current prices, any references to such does not indicate future market action.
**There is substantial risk of loss in trading futures and options.** These recommendations are a solicitation for entering into derivatives transactions. All known news and events have already been factored into the price of the underlying derivatives discussed. From time to time persons affiliated with Zaner, or its associated companies, may have positions in recommended and other derivatives. Past performance is not indicative of future results. The information and data in this report were obtained from sources considered reliable. Their accuracy or completeness is not guaranteed. Any decision to purchase or sell as a result of the opinions expressed in this report will be the full responsibility of the person authorizing such transaction. Seasonal tendencies are a composite of some of the more consistent commodity futures seasonals that have occurred over the past 15 or more years. There are usually underlying, fundamental circumstances that occur annually that tend to cause the futures markets to react in similar directional manner during a certain calendar year. While seasonal trends may potentially impact supply and demand in certain commodities, seasonal aspects of supply and demand have been factored into futures & options market pricing. Even if a seasonal tendency occurs in the future, it may not result in a profitable transaction as fees and the timing of the entry and liquidation may impact on the results. No representation is being made that any account has in the past, or will in the future, achieve profits using these recommendations. No representation is being made that price patterns will recur in the future.
Author

Carley Garner
DeCarley Trading
Carley Garner is an experienced commodity broker with DeCarley Trading, a division of Zaner, in Las Vegas, Nevada. She is also the author of multiple books including, “Higher Probability Commodity Trading” and “A Trader's First Book on Commodities”.


