Texas Instruments Inc. Elliott Wave technical analysis [Video]
![Texas Instruments Inc. Elliott Wave technical analysis [Video]](https://editorial.fxstreet.com/images/Markets/Equities/Industries/Materials/pic-extracting-mine-materials_XtraLarge.jpg)
TXN Elliott Wave technical analysis
Function: Trend
Mode: Impulsive
Structure: Motive
Position: Minor wave 3.
Direction: Upside into wave 3.
Details: We are witnessing a three wave move from the 200$ ATH which seems to be corrective in nature as well as complete. We are now looking at the possibility of the resumption of the uptrend within Primary wave 5.
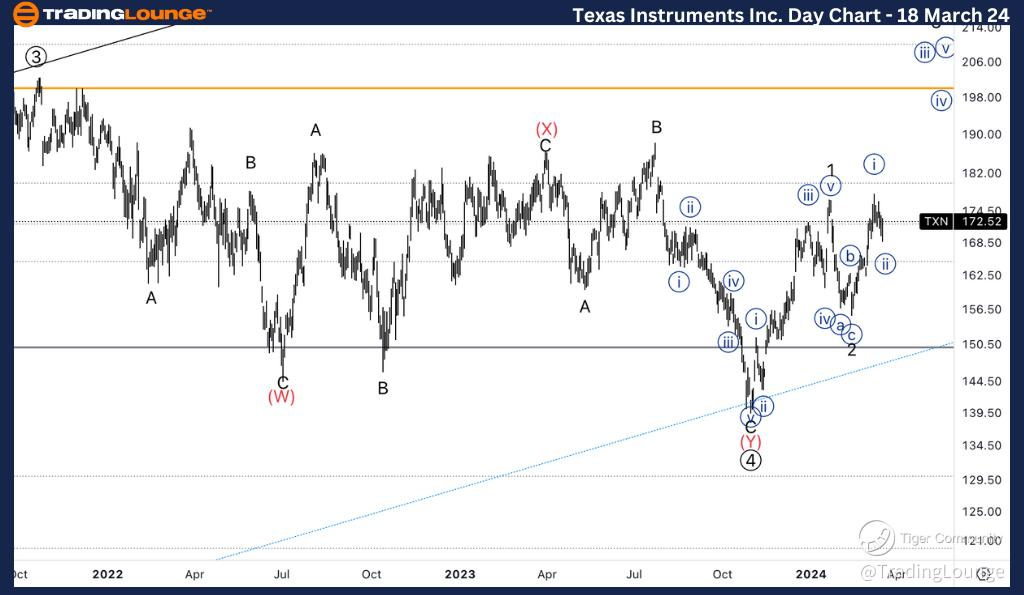
TXN Elliott Wave technical analysis – Daily chart
Our analysis identifies a trending function characterized by impulsive mode and motive structure, positioned in Minor wave 3. The direction is on the upside into wave 3. We've observed a corrective three-wave move from the $200 all-time high (ATH), which appears to be complete. Now, our focus shifts to the possibility of the uptrend resuming within Primary wave 5.
TXN Elliott Wave technical analysis
Function: Trend
Mode: Impulsive
Structure: Motive
Position: Wave (i) of {iii}.
Direction: Upside into Minute wave {iii}.
Details: Looking for a three wave move into wave {ii} to now resume higher into wave {iii}. As we have taken the top of wave 1 out, we can have a stronger conviction of the overall upside resumption.
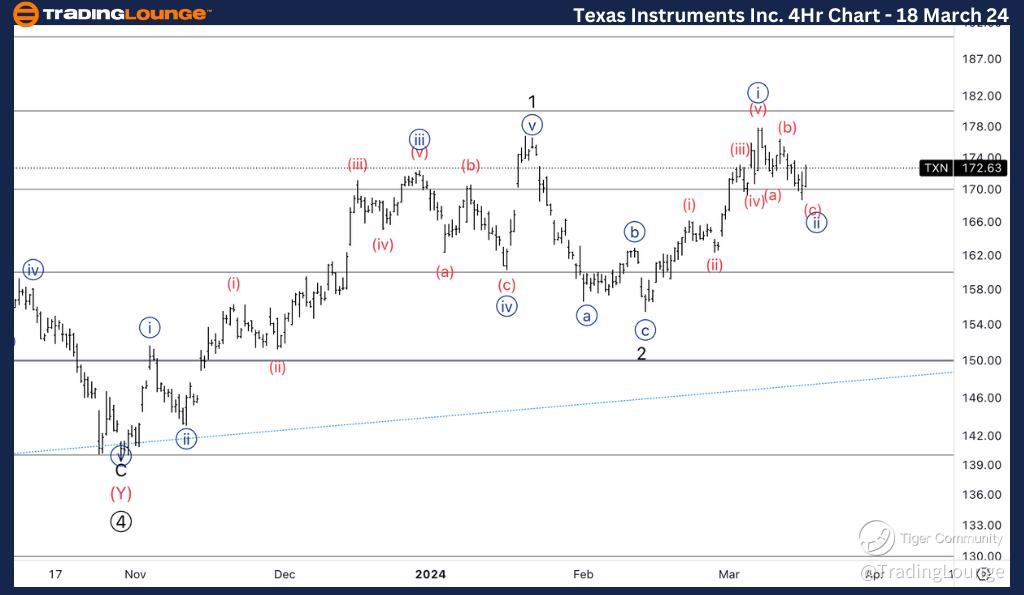
TXN Elliott Wave technical analysis – Four-hour chart
Here, we also identify a trending function marked by impulsive mode and motive structure, positioned in Wave (i) of {iii}. The direction is on the upside into Minute wave {iii}. We anticipate a three-wave move into wave {ii} followed by a resumption higher into wave {iii}. With the top of wave 1 taken out, we have increased conviction regarding the overall upside resumption.
Texas Instruments Inc. Elliott Wave technical analysis [Video]
Author

Peter Mathers
TradingLounge
Peter Mathers started actively trading in 1982. He began his career at Hoei and Shoin, a Japanese futures trading company.


