Stock prices extend advances – Will they retrace all declines?
Stocks were advancing on Friday, fueled by the Thursday’s earnings release from AAPL and the monthly jobs data that was released before the session opened. The S&P 500 index gained 1.26% following a 0.9% advance on Thursday. The market was the highest since April as the index went back above the 5,100 level.
On Friday, April 19, the index hit a new medium-term low of 4,953.56. This marked its lowest level since late February, with a decline of over 311 points or 5.9% from the record high of 5,264.85 on February 28. Recently, stock prices rebounded as tensions in the Middle East eased, and investors shifted their focus to quarterly earnings releases.
This morning, the futures contract is gaining 0.4%, with the S&P 500 likely to open higher and extend its late last week’s advances as the sentiment remains positive.
Last Wednesday, in my Stock Price Forecast for May, I noted “The question arises: Is this merely a correction or the beginning of a more significant downtrend? It's difficult to determine at this point. Last month, hopes for a Fed pivot were dashed as new data reignited inflation fears, and geopolitical tensions added further uncertainty. However, as of today, it appears the market is only correcting a rally that began in November.”
The investor sentiment improved last week, as indicated by the Wednesday’s AAII Investor Sentiment Survey, which showed that 38.5% of individual investors are bullish, while 32.5% of them are bearish. The AAII sentiment is a contrary indicator in the sense that highly bullish readings may suggest excessive complacency and a lack of fear in the market. Conversely, bearish readings are favorable for market upturns.
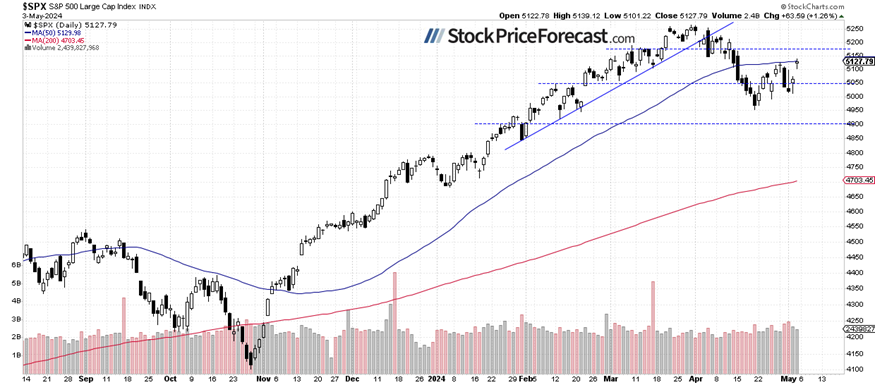
The S&P 500 retraced some more of its mid-April sell-off on Friday, as we can see on the daily chart.
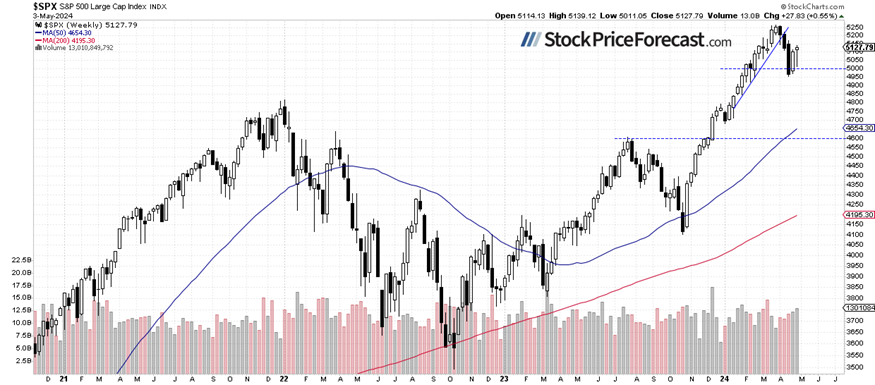
S&P 500 gained 0.55% last week
Compared to the previous Friday’s closing price, the index gained 0.55%, slightly extending its previous week’s rebound of 2.7%. On April 12, I wrote that “Short-term consolidation near the new records may suggest that the market is potentially topping out, though no clearly negative signals are evident yet.” Indeed, the market topped out, breaking below its upward trend line, and accelerated a short-term downtrend. It’s worth noticing that last week, the index bounced from a support level of around 5,000 again, as we can see on the weekly chart.
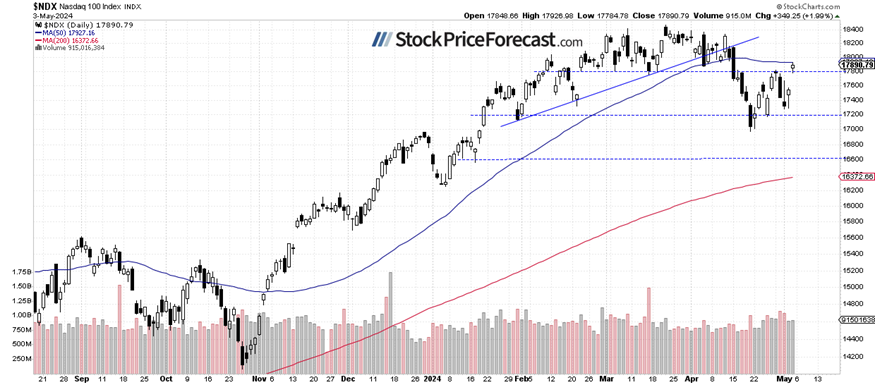
Nasdaq 100 – Closer to 18,000
The technology-focused Nasdaq 100 index extended its Thursday’s gain of 1.3% on Friday, closing 1.99% higher. The market rallied after the earnings release from AAPL. It’s getting close to the resistance level of 18,000 again. This morning, the Nasdaq 100 is expected to open 0.4% higher.
VIX is below 14
The VIX index, also known as the fear gauge, is derived from option prices. In late March, it was trading around the 13 level. However, market volatility has led to an increase in the VIX, and on previous Friday, it reached a high of 21.4 - the highest since late October, signaling fear in the market. Recently it went lower again, and on Friday it was as low as 13.48, showing more complacency in the market.
Historically, a dropping VIX indicates less fear in the market, and rising VIX accompanies stock market downturns. However, the lower the VIX, the higher the probability of the market’s downward reversal.

Futures contract extends advances
Let’s take a look at the hourly chart of the S&P 500 futures contract. This morning, it is breaking above the 5,150 level, reaching a local high of around 5,177. The next resistance level is at 5,200-5,220, marked by the early April fluctuations. The support level is at 5,140-5,150, among others.

Conclusion
Last week, the S&P 500 index bounced from the 5,000 level again, reaching a local high of around 5,140 on Friday. This morning, the market is likely to extend the advance. However, it could face some resistance as it gets near the 5,150 level, a key level marking previous local lows.
In the first half of April, the S&P 500 was continuing a correction from the March 28 record high of 5,264.85 on Middle East tensions, strong U.S. dollar. Recently, it sold off below the important 5,000 level, and last week, it kept retracing the declines as earnings and economic data lifted the sentiment again.
Last Tuesday, I mentioned “While earnings reports offer cause for cautious optimism, it remains uncertain whether last week's gains signify a true upward reversal or simply a correction of recent declines.” The pullback in stock prices brought even more uncertainty, with both bullish and bearish scenarios seeming likely depending on market reactions to data and earnings.
In my Stock Price Forecast for May, I added “Where will the market go in May? There's a popular saying: 'Sell in May and go away,' but statistics don't consistently support such clear seasonal patterns or cycles. The safe bet for May is likely sideways trading, with investors digesting recent data suggesting that inflation may not be transitory, and the Fed could maintain its relatively tight monetary policy. However, economic data isn't entirely negative, and strong earnings from companies may continue to fuel the bull market.”
For now, my short-term outlook remains neutral.
I think that no positions are justified from the risk/reward point of view.
Here’s the breakdown:
-
The S&P 500 is likely to open slightly higher, extending its last week’s rebound.
-
On Friday, April 19, stock prices were the lowest since February, indicating a correction of the medium-term advance.
-
In my opinion, the short-term outlook is neutral.
Want free follow-ups to the above article and details not available to 99%+ investors? Sign up to our free newsletter today!
Want free follow-ups to the above article and details not available to 99%+ investors? Sign up to our free newsletter today!
Author

Paul Rejczak
Sunshine Profits
Paul Rejczak is a stock market strategist who has been known for the quality of his technical and fundamental analysis since the late nineties.


