|

S&P500 technical analysis: Stocks retreat as trade war advances

  • The Markit preliminary PMI (May) for both the EU and the US missed expectations increasing fears of a global economic slowdown led by the Sino-US trade war.
  • The S&P500 takes a dive but remain above the 2,800.00 mark.
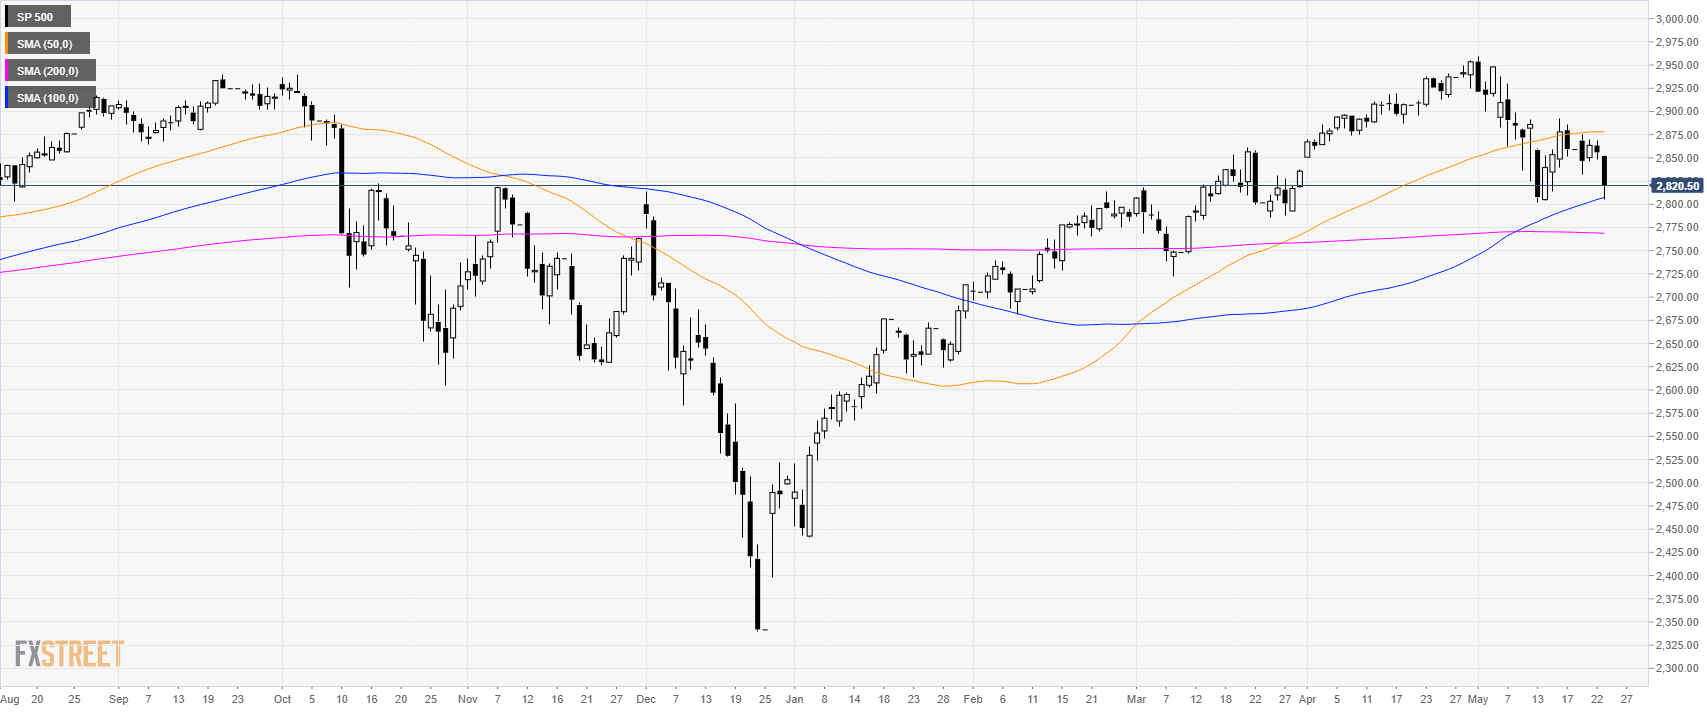
S&P500 daily chart
 
The S&P500 Index is in a bull trend above its 100 and 200-period simple moving averages (SMAs).
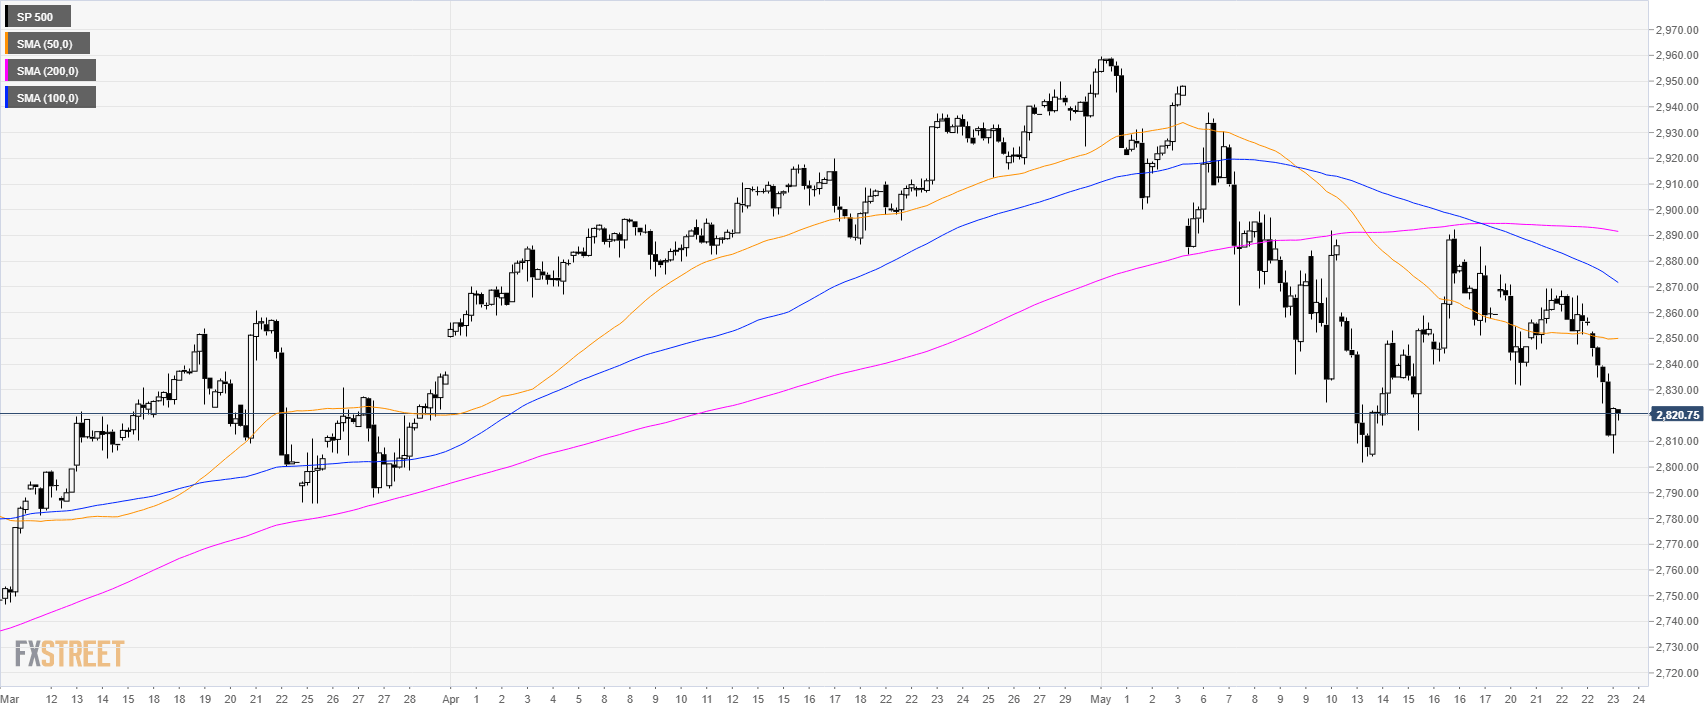
S&P500 4-hour chart


The market is trading below its main SMAs as the index almost reached the 2,800.00 level.


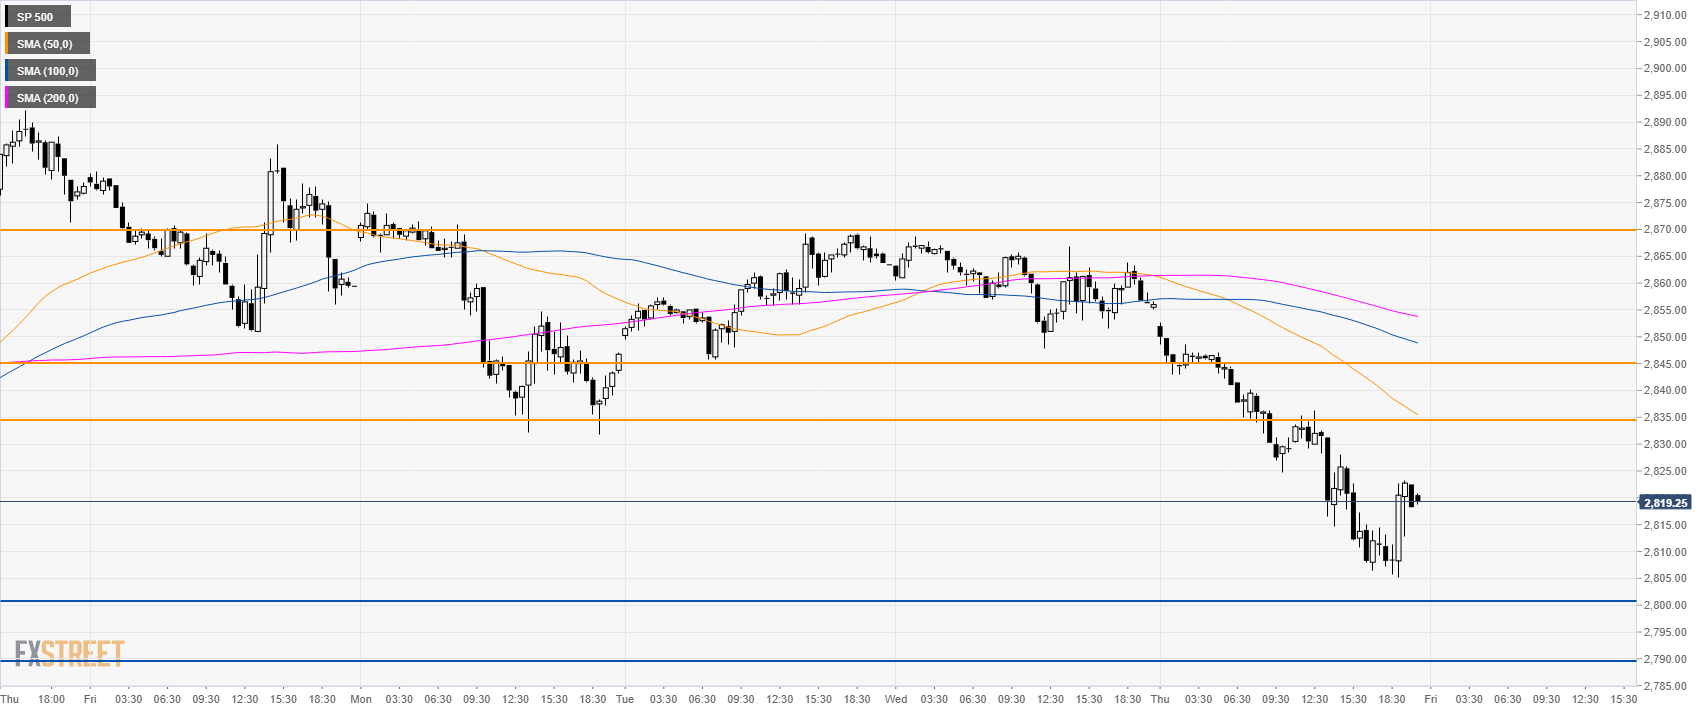
S&P500 30-minute chart


The S&P500 is trading below its main SMAs suggesting bearish momentum in the near term. Bears can still have another leg down to 2,800.00 and 2,790.00 support. Resistances are seen at 2,835 and 2,845.00 levels.


Additional key levels

SP 500

Overview
Today last price2820.25
Today Daily Change-35.75
Today Daily Change %-1.25
Today daily open2856
 
Trends
Daily SMA202886.34
Daily SMA502878.22
Daily SMA1002805.18
Daily SMA2002769.08
Levels
Previous Daily High2868.75
Previous Daily Low2847.75
Previous Weekly High2892.25
Previous Weekly Low2801.75
Previous Monthly High2954.75
Previous Monthly Low2850.25
Daily Fibonacci 38.2%2855.77
Daily Fibonacci 61.8%2860.73
Daily Pivot Point S12846.25
Daily Pivot Point S22836.5
Daily Pivot Point S32825.25
Daily Pivot Point R12867.25
Daily Pivot Point R22878.5
Daily Pivot Point R32888.25

Author

Flavio Tosti

Flavio Tosti

Independent Analyst


More from Flavio Tosti
Share:

Editor's Picks

EUR/USD holds steady above 1.1850 in quiet session

EUR/USD stays defensive but holds 1.1850 amid quiet markets in the European hours on Monday.  The US Dollar is struggling for direction due to thin liquidity conditions as US markets are closed in observance of Presidents' Day holiday. 

GBP/USD flat lines near 1.3650 ahead of UK and US data

GBP/USD kicks off a new week on a subdued note and oscillates in a narrow range near 1.3650 on Monday. The mixed fundamental backdrop warrants some caution for aggressive traders as the market focus now shifts to this week's important data releases from the UK and the US.

Gold corrects lower, tries to stabilize above $5,000

Gold started the week under bearish pressure and declined to the $4,960 area before staging a modest rebound. As trading volumes remain thin with the US financial markets remaining closed on Presidents' Day holiday, XAU/USD looks to stabilize above $5,000 ahead of this week's key data releases.

Bitcoin consolidates as on-chain data show mixed signals

Bitcoin price has consolidated between $65,700 and $72,000 over the past nine days, with no clear directional bias. US-listed spot ETFs recorded a $359.91 million weekly outflow, marking the fourth consecutive week of withdrawals.

The week ahead: Key inflation readings and why the AI trade could be overdone

It is likely to be a quiet start to the week, with US markets closed on Monday for Presidents Day. European markets are higher across the board and gold is clinging to the $5,000 level after the tamer than expected CPI report in the US reduced haven flows to precious metals.

Monero Price Forecast: XMR risks a drop below $300 under mounting bearish pressure

Monero (XMR) starts the week under pressure, recording a 4% decline at press time on Monday after a 7% drop the previous day, putting the $300 support zone in focus.