S&P/TSX 60 index Elliott Wave technical analysis [Video]
![S&P/TSX 60 index Elliott Wave technical analysis [Video]](https://editorial.fxstreet.com/images/Markets/Equities/FTSE/ftse-100-index-17327640_XtraLarge.jpg)
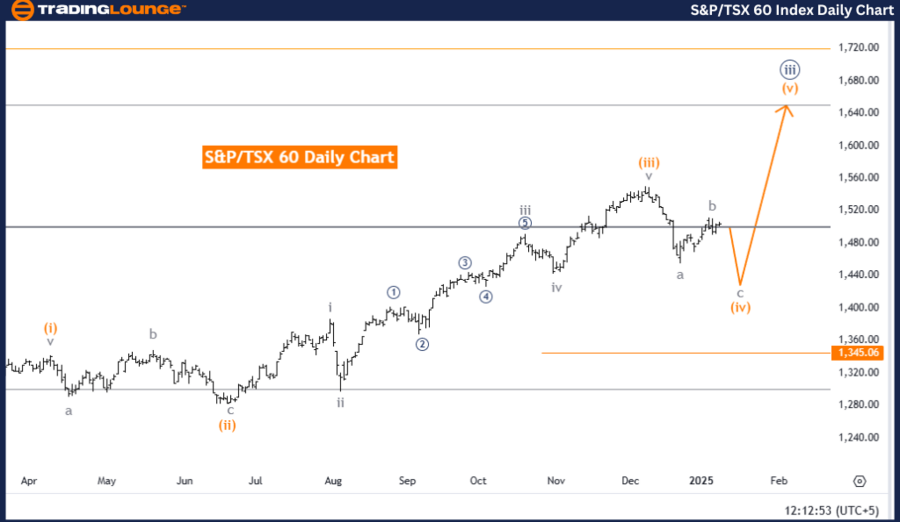
S&P/TSX 60 Elliott Wave Analysis Trading Lounge Day Chart.
S&P/TSX 60 Elliott Wave technical analysis
-
Function: Counter Trend.
-
Mode: Corrective.
-
Structure: Orange Wave 4.
-
Position: Navy Blue Wave 3.
-
Direction next higher degrees: Orange Wave 5.
-
Details: Orange wave three appears complete, and orange wave four is currently in play.
-
Wave cancel invalid level: 1,345.06.
The S&P/TSX 60 Index is currently in a counter-trend corrective phase, as indicated by Elliott Wave Analysis on the daily chart. This corrective phase corresponds to orange wave four, part of the broader navy blue wave three structure. With orange wave three likely completed, the market has transitioned into orange wave four.
Key insights:
-
Orange Wave 4 as a Corrective Phase:
Orange wave four represents a retracement within the overall bullish trend. This phase is a typical correction that occurs after an impulsive wave, such as orange wave three. -
Transition to Orange Wave 5:
Following the completion of orange wave four, the market is expected to enter orange wave five, resuming the upward movement and continuing the broader bullish trend. -
Invalidation Level:
The 1,345.06 level is the invalidation benchmark. If the price moves below this level, the current wave count will be invalidated, requiring a reassessment of the Elliott Wave structure.
Conclusion:
The S&P/TSX 60 Index is navigating a corrective phase represented by orange wave four within navy blue wave three. This phase indicates a temporary pullback in preparation for the resumption of the upward trend through orange wave five. Monitoring the 1,345.06 invalidation level is crucial to validating the current wave scenario. As orange wave four progresses, it sets the foundation for the next impulsive phase, reinforcing the overall bullish structure within the Elliott Wave framework.
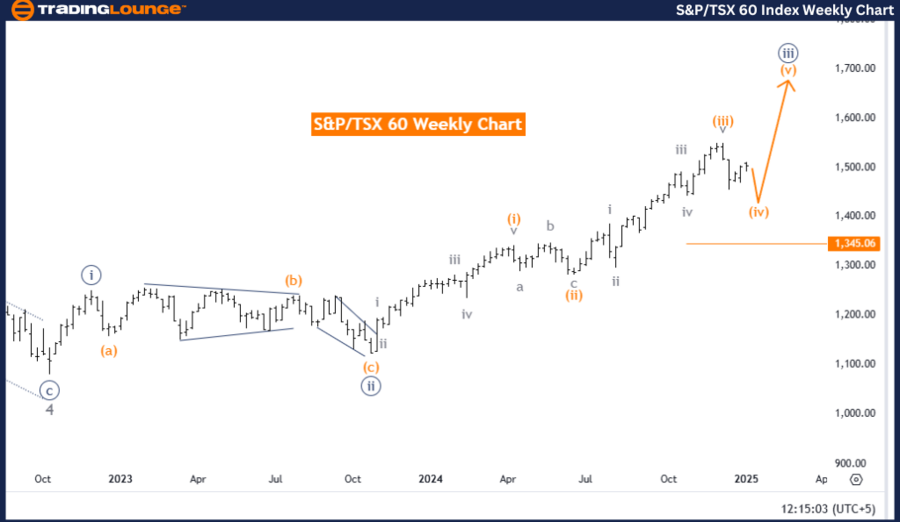
S&P/TSX 60 Elliott Wave Analysis Trading Lounge Weekly Chart
S&P/TSX 60 Elliott Wave technical analysis
-
Function: Counter Trend.
-
Mode: Corrective.
-
Structure: Orange Wave 4.
-
Position: Navy Blue Wave 3.
-
Direction next higher degrees: Orange Wave 5.
-
Details: Orange wave three appears completed, and orange wave four is currently in progress.
-
Wave cancel invalid level: 1,345.06.
The S&P/TSX 60 Index is currently in a counter-trend corrective phase, as revealed by Elliott Wave Analysis on the weekly chart. This phase is identified as orange wave four, which is part of the broader navy blue wave three structure. The conclusion of orange wave three has set the foundation for the active progression of orange wave four.
Key insights:
-
Orange Wave 4 as a Corrective Move:
Orange wave four reflects a natural corrective phase, following the impulsive upward momentum of orange wave three. This phase aligns with the standard alternation between impulsive and corrective waves within Elliott Wave Theory. -
Transition to Orange Wave 5:
Upon the completion of orange wave four, the market is expected to enter orange wave five, resuming the upward trajectory and continuing the broader bullish movement. -
Invalidation Level:
The analysis identifies 1,345.06 as the invalidation benchmark. If the price falls below this level, the current wave structure will no longer be valid, requiring a reassessment of the Elliott Wave count.
Conclusion:
The S&P/TSX 60 Index is in a corrective phase denoted by orange wave four, within the larger framework of navy blue wave three. This phase represents a temporary pause in the upward trend, providing a necessary retracement before the resumption of bullish momentum through orange wave five.
The 1,345.06 invalidation level is a critical reference point to validate the ongoing wave structure and ensure the accuracy of the analysis. As orange wave four progresses, it forms an integral part of the Elliott Wave sequence, preparing the market for its next impulsive phase.
Technical analyst: Malik Awais.
S&P/TSX 60 Elliott Wave technical analysis [Video]
Author

Peter Mathers
TradingLounge
Peter Mathers started actively trading in 1982. He began his career at Hoei and Shoin, a Japanese futures trading company.


