• The S&P 500 advances 0.07% is sitting at 4702, with energy and materials as the leading gainers.
  • The Dow Jones Industrial adds 0.23%, currently at 36,412.
  • The Nasdaq Composite is barely down 0.01%  at 16,358.

The S&P 500 edges higher in the New York session, up some 0.08%, sits at 4,701 at the time of writing. The Dow Jones Industrial adds 0.23%, up to 36,412, while the Nasdaq Composite falls 0.01%, at 16,358. Positive US jobs data last Friday, coupled with a dovish taper by the Federal Reserve on Wednesday, prompted investors towards riskier assets, as US equity indices keep posting new all-time highs on the last week.

Furthermore, robust third-quarter earnings ease market participants’ worries about heightened inflation. In the last week, three central banks unveiled their monetary policy statements, in which It can be read that inflation is transitory despite high energy prices, blaming supply constraints and bottlenecks, coinciding that once those factors ease, inflation will moderate.

Sector-wise, Energy, Materials, and Financials are the gainers, rising 1.34%, 1.08%, and 0.84%, respectively. On the other hand, the main losers are Utilities and Consumer Staples, down 1.60% and 1.1%.

S&P 500 Price Forecast: Technical outlook

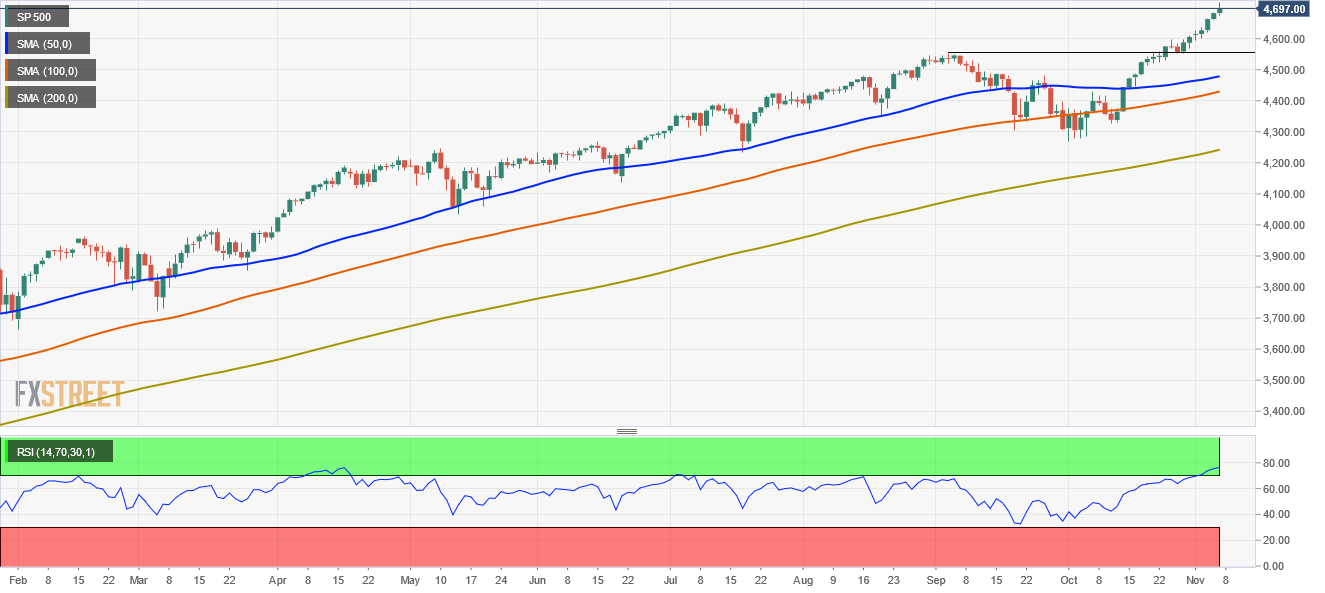
The daily chart shows the index keeps in a solid upward trend, showing no signs of exhaustion, despite that the Relative Strength Index (RSI) is at overbought levels at 77, aiming higher. Furthermore, the daily moving averages (DMA’s) are below the index value, sitting well below the 4,500 level. However, in case of a correction lower, the first demand zone would be the September 3 high at 4,550. 

SP 500 TECHNICAL SUPPORT/RESISTANCE LEVELS

Overview
Today last price 4697
Today Daily Change 0.00
Today Daily Change % 0.00
Today daily open 4697
 
Trends
Daily SMA20 4539.65
Daily SMA50 4478.84
Daily SMA100 4429.95
Daily SMA200 4237.99
 
Levels
Previous Daily High 4718.2
Previous Daily Low 4674.8
Previous Weekly High 4718.2
Previous Weekly Low 4594.5
Previous Monthly High 4608.9
Previous Monthly Low 4270.1
Daily Fibonacci 38.2% 4701.62
Daily Fibonacci 61.8% 4691.38
Daily Pivot Point S1 4675.13
Daily Pivot Point S2 4653.27
Daily Pivot Point S3 4631.73
Daily Pivot Point R1 4718.53
Daily Pivot Point R2 4740.07
Daily Pivot Point R3 4761.93


Share: Feed news

Information on these pages contains forward-looking statements that involve risks and uncertainties. Markets and instruments profiled on this page are for informational purposes only and should not in any way come across as a recommendation to buy or sell in these assets. You should do your own thorough research before making any investment decisions. FXStreet does not in any way guarantee that this information is free from mistakes, errors, or material misstatements. It also does not guarantee that this information is of a timely nature. Investing in Open Markets involves a great deal of risk, including the loss of all or a portion of your investment, as well as emotional distress. All risks, losses and costs associated with investing, including total loss of principal, are your responsibility. The views and opinions expressed in this article are those of the authors and do not necessarily reflect the official policy or position of FXStreet nor its advertisers. The author will not be held responsible for information that is found at the end of links posted on this page.

If not otherwise explicitly mentioned in the body of the article, at the time of writing, the author has no position in any stock mentioned in this article and no business relationship with any company mentioned. The author has not received compensation for writing this article, other than from FXStreet.

FXStreet and the author do not provide personalized recommendations. The author makes no representations as to the accuracy, completeness, or suitability of this information. FXStreet and the author will not be liable for any errors, omissions or any losses, injuries or damages arising from this information and its display or use. Errors and omissions excepted.

The author and FXStreet are not registered investment advisors and nothing in this article is intended to be investment advice.

Recommended content


Recommended content

Editors’ Picks

EUR/USD holds above 1.0700 ahead of key US data

EUR/USD holds above 1.0700 ahead of key US data

EUR/USD trades in a tight range above 1.0700 in the early European session on Friday. The US Dollar struggles to gather strength ahead of key PCE Price Index data, the Fed's preferred gauge of inflation, and helps the pair hold its ground. 

EUR/USD News

USD/JPY stays above 156.00 after BoJ Governor Ueda's comments

USD/JPY stays above 156.00 after BoJ Governor Ueda's comments

USD/JPY holds above 156.00 after surging above this level with the initial reaction to the Bank of Japan's decision to leave the policy settings unchanged. BoJ Governor said weak Yen was not impacting prices but added that they will watch FX developments closely.

USD/JPY News

Gold price oscillates in a range as the focus remains glued to the US PCE Price Index

Gold price oscillates in a range as the focus remains glued to the US PCE Price Index

Gold price struggles to attract any meaningful buyers amid the emergence of fresh USD buying. Bets that the Fed will keep rates higher for longer amid sticky inflation help revive the USD demand.

Gold News

Sei Price Prediction: SEI is in the zone of interest after a 10% leap

Sei Price Prediction: SEI is in the zone of interest after a 10% leap

Sei price has been in recovery mode for almost ten days now, following a fall of almost 65% beginning in mid-March. While the SEI bulls continue to show strength, the uptrend could prove premature as massive bearish sentiment hovers above the altcoin’s price.

Read more

US core PCE inflation set to signal firm price pressures as markets delay Federal Reserve rate cut bets

US core PCE inflation set to signal firm price pressures as markets delay Federal Reserve rate cut bets

The core PCE Price Index, which excludes volatile food and energy prices, is seen as the more influential measure of inflation in terms of Fed positioning. The index is forecast to rise 0.3% on a monthly basis in March, matching February’s increase. 

Read more

Forex MAJORS

Cryptocurrencies

Signatures