|

S&P 500 settles Tuesday at $4,357 as investors hope for a receding Fed

  • US equities saw mild lift on Tuesday, with broader indexes rising across the board.
  • Investors are leaning into expectations of no more rate hikes from the Fed.
  • With US inflation figures due later this week, investors will get the chance to readjust their expectations.

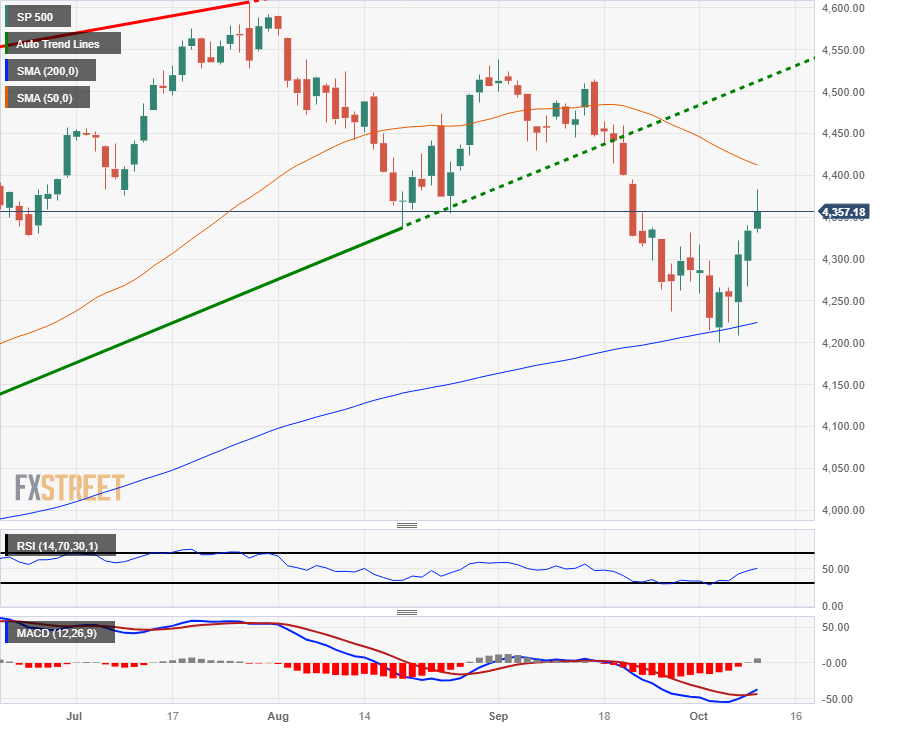
The Standard & Poor's 500 major equity index climbed on Tuesday, reaching an intraday peak of $4,382.92 before settling back slightly into $4,357, gaining 22.58 points, or 0.52%.

The other major equity boards saw similar gains for the day, with the Dow Jones Industrial Average (DJIA) climbing 134.65 points to $33,739.30, gaining 0.40%, and the NASDAQ Composite index rising 78.60 point to close up 0.58% at $13,562.84.

Federal Reserve (Fed) officials came in mixed on Tuesday, but mostly on-brand for the US central bank; inflation remains elevated, but the Fed sees price growth pressures subsiding into the future, and if inflation figures continue to waft softly lower, it's unlikely that the Fed will see additional rate hikes to close out 2023.

Fed officials cool inflation expectations, but warn that policy room remains

Fed's Bostic: We don't need to increase rates any more

NY Fed's Perli: No sign yet Fed needs to change balance sheet plans

Fed's Kashkari: We may have to raises rates further if the economy stays too strong

The weekend's geopolitical escalation of the long-running Israel-Hamas conflict saw concerns about stability in the Middle East on the rise, but equities have absorbed the escalation, and investors will be keeping an eye out for an escalation of combative rhetoric from the US against Iran or Saudi Arabia.

The US, an ardent supporter of Israel, has a finger on the trigger if Iran makes any moves to prop up the Palestinian Hamas, but despite the risks, equity markets have shrugged off the potential for escalation until more evidence presents itself.

S&P 500 Technical Outlook

Tuesday's gains see the S&P 500 edge higher and close in the green for the third consecutive trading day, and the index has closed higher for four of the last five market sessions.

The S&P 500 recently rebounded from the 200-day Simple Moving Average (SMA) near $4,225, but a continuation of bullish momentum will need to overcome a bearish 50-day SMA, currently descending into $4,400.

S&P 500 Daily Chart

S&P 500 Technical Levels

SP 500

Overview
Today last price4357.18
Today Daily Change23.29
Today Daily Change %0.54
Today daily open4333.89
 
Trends
Daily SMA204347.88
Daily SMA504416.68
Daily SMA1004402.6
Daily SMA2004223.93
 
Levels
Previous Daily High4340.25
Previous Daily Low4266.9
Previous Weekly High4321.94
Previous Weekly Low4199.8
Previous Monthly High4538.24
Previous Monthly Low4237.48
Daily Fibonacci 38.2%4312.23
Daily Fibonacci 61.8%4294.92
Daily Pivot Point S14287.11
Daily Pivot Point S24240.33
Daily Pivot Point S34213.76
Daily Pivot Point R14360.46
Daily Pivot Point R24387.03
Daily Pivot Point R34433.81

Author

Joshua Gibson

Joshua joins the FXStreet team as an Economics and Finance double major from Vancouver Island University with twelve years' experience as an independent trader focusing on technical analysis.

More from Joshua Gibson
Share:

Markets move fast. We move first.

Orange Juice Newsletter brings you expert driven insights - not headlines. Every day on your inbox.

By subscribing you agree to our Terms and conditions.

Editor's Picks

EUR/USD: Bulls pray for a dovish Fed

EUR/USD has finally taken a breather after a pretty energetic climb. The pair broke above 1.1680 in the second half of the week, reaching its highest levels in around two months before running into some selling pressure. Even so, it has gained almost two cents from the late-November dip just below 1.1500 the figure.

GBP/USD trims gains, recedes toward 1.3320

GBP/USD is struggling to keep its daily advance, coming under fresh pressure and retreating to the 1.3320 zone following a mild bullish attempt in the Greenback. Even though US consumer sentiment surprised to the upside, the US Dollar isn’t getting much love, as traders are far more interested in what the Fed will say next week.

Gold: Bullish momentum fades despite broad USD weakness

After rising more than 3.5% in the previous week, Gold has entered a consolidation phase and fluctuated at around $4,200. The Federal Reserve’s interest rate decision and revised Summary of Economic Projections, also known as the dot plot, could trigger the next directional move in XAU/USD. 

Week ahead: Rate cut or market shock? The Fed decides

Fed rate cut widely expected; dot plot and overall meeting rhetoric also matter. Risk appetite is supported by Fed rate cut expectations; cryptos show signs of life. RBA, BoC and SNB also meet; chances of surprises are relatively low. Dollar weakness could linger; both the aussie and the yen best positioned to gain further. Gold and oil eye Ukraine-Russia developments; a peace deal remains elusive.

Week ahead – Rate cut or market shock? The Fed decides

Fed rate cut widely expected; dot plot and overall meeting rhetoric also matter. Risk appetite is supported by Fed rate cut expectations; cryptos show signs of life. RBA, BoC and SNB also meet; chances of surprises are relatively low.

Ripple faces persistent bear risks, shrugging off ETF inflows

Ripple is extending its decline for the second consecutive day, trading at $2.06 at the time of writing on Friday. Sentiment surrounding the cross-border remittance token continues to lag despite steady inflows into XRP spot ETFs.